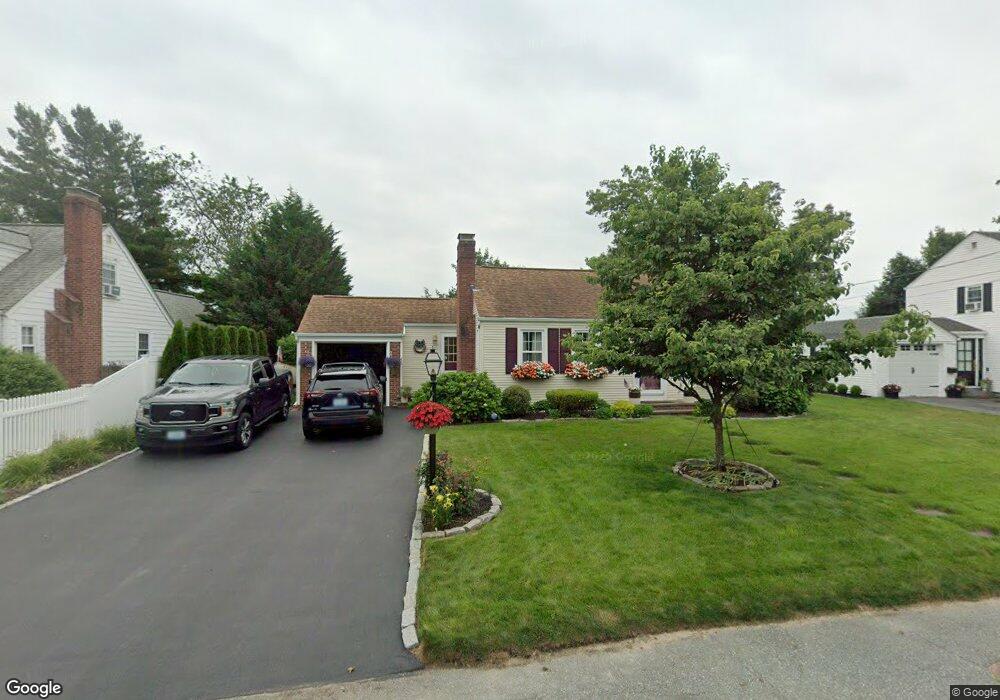
41 Hilltop Dr Cranston, RI 02920
Mayfield NeighborhoodEstimated Value: $441,669 - $563,000
3
Beds
2
Baths
1,243
Sq Ft
$394/Sq Ft
Est. Value
About This Home
This home is located at 41 Hilltop Dr, Cranston, RI 02920 and is currently estimated at $489,417, approximately $393 per square foot. 41 Hilltop Dr is a home located in Providence County with nearby schools including Garden City School, Western Hills Middle School, and Cranston High School West.
Ownership History
Date
Name
Owned For
Owner Type
Purchase Details
Closed on
Sep 27, 1999
Sold by
Wardle Jeffrey J and Wardle Robin Lyn
Bought by
Brown David A and Brown Cynthia
Current Estimated Value
Purchase Details
Closed on
Sep 15, 1993
Sold by
Armstrong David A
Bought by
Trainor Kevin M and Trainor Martha
Create a Home Valuation Report for This Property
The Home Valuation Report is an in-depth analysis detailing your home's value as well as a comparison with similar homes in the area
Home Values in the Area
Average Home Value in this Area
Purchase History
| Date | Buyer | Sale Price | Title Company |
|---|---|---|---|
| Brown David A | $128,000 | -- | |
| Trainor Kevin M | $100,000 | -- |
Source: Public Records
Mortgage History
| Date | Status | Borrower | Loan Amount |
|---|---|---|---|
| Open | Trainor Kevin M | $140,000 | |
| Closed | Trainor Kevin M | $100,000 | |
| Closed | Trainor Kevin M | $30,000 |
Source: Public Records
Tax History Compared to Growth
Tax History
| Year | Tax Paid | Tax Assessment Tax Assessment Total Assessment is a certain percentage of the fair market value that is determined by local assessors to be the total taxable value of land and additions on the property. | Land | Improvement |
|---|---|---|---|---|
| 2024 | $4,539 | $333,500 | $112,200 | $221,300 |
| 2023 | $4,417 | $233,700 | $73,900 | $159,800 |
| 2022 | $4,326 | $233,700 | $73,900 | $159,800 |
| 2021 | $4,207 | $233,700 | $73,900 | $159,800 |
| 2020 | $4,000 | $192,600 | $70,400 | $122,200 |
| 2019 | $4,000 | $192,600 | $70,400 | $122,200 |
| 2018 | $3,908 | $192,600 | $70,400 | $122,200 |
| 2017 | $3,842 | $167,500 | $63,300 | $104,200 |
| 2016 | $3,760 | $167,500 | $63,300 | $104,200 |
| 2015 | $3,760 | $167,500 | $63,300 | $104,200 |
| 2014 | $3,618 | $158,400 | $63,300 | $95,100 |
Source: Public Records
Map
Nearby Homes