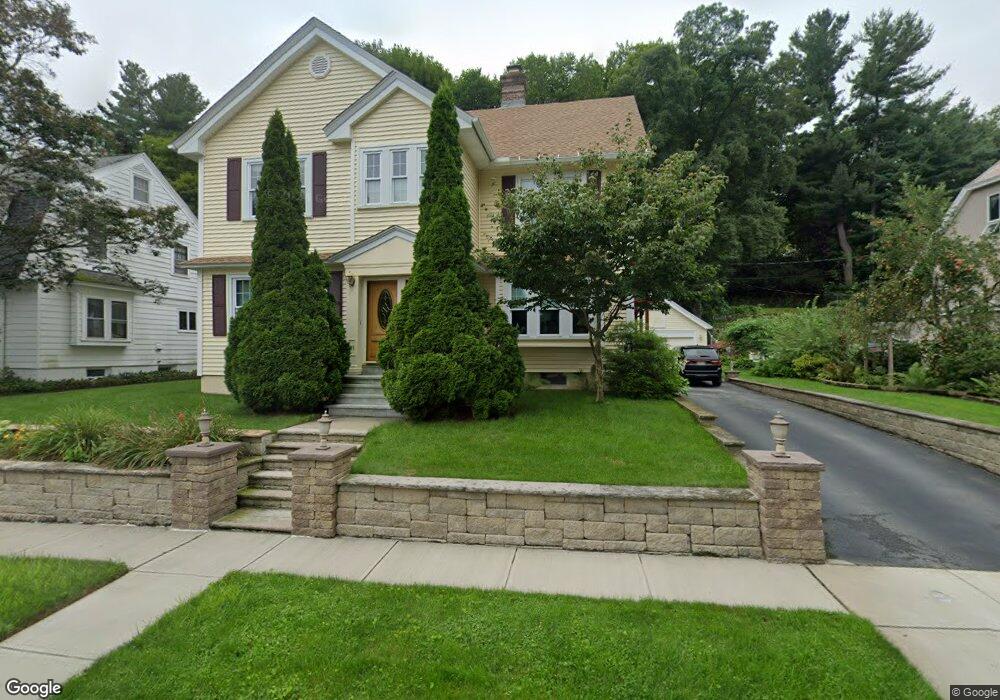
41 Laconia Rd Worcester, MA 01609
Forest Grove NeighborhoodEstimated Value: $567,405 - $623,000
3
Beds
2
Baths
2,217
Sq Ft
$268/Sq Ft
Est. Value
About This Home
This home is located at 41 Laconia Rd, Worcester, MA 01609 and is currently estimated at $594,851, approximately $268 per square foot. 41 Laconia Rd is a home located in Worcester County with nearby schools including Nelson Place Elementary School, Jacob Hiatt Magnet School, and Chandler Magnet.
Ownership History
Date
Name
Owned For
Owner Type
Purchase Details
Closed on
May 22, 2020
Sold by
Holland Mark C and Holland Lisa P
Bought by
Mark C & Lisa P Holland Irt
Current Estimated Value
Purchase Details
Closed on
Dec 15, 1993
Sold by
Painton Amelia G
Bought by
Holland Mark C and Holland Lisa
Home Financials for this Owner
Home Financials are based on the most recent Mortgage that was taken out on this home.
Original Mortgage
$100,000
Interest Rate
7.03%
Mortgage Type
Purchase Money Mortgage
Create a Home Valuation Report for This Property
The Home Valuation Report is an in-depth analysis detailing your home's value as well as a comparison with similar homes in the area
Home Values in the Area
Average Home Value in this Area
Purchase History
| Date | Buyer | Sale Price | Title Company |
|---|---|---|---|
| Mark C & Lisa P Holland Irt | -- | None Available | |
| Holland Mark C | $125,000 | -- |
Source: Public Records
Mortgage History
| Date | Status | Borrower | Loan Amount |
|---|---|---|---|
| Previous Owner | Holland Mark C | $75,000 | |
| Previous Owner | Holland Mark C | $100,000 | |
| Previous Owner | Holland Mark C | $20,000 |
Source: Public Records
Tax History
| Year | Tax Paid | Tax Assessment Tax Assessment Total Assessment is a certain percentage of the fair market value that is determined by local assessors to be the total taxable value of land and additions on the property. | Land | Improvement |
|---|---|---|---|---|
| 2025 | $6,540 | $495,800 | $123,600 | $372,200 |
| 2024 | $6,397 | $465,200 | $123,600 | $341,600 |
| 2023 | $6,149 | $428,800 | $106,400 | $322,400 |
| 2022 | $5,705 | $375,100 | $85,200 | $289,900 |
| 2021 | $5,662 | $347,800 | $68,100 | $279,700 |
| 2020 | $5,477 | $322,200 | $68,000 | $254,200 |
| 2019 | $5,566 | $309,200 | $65,600 | $243,600 |
| 2018 | $5,516 | $291,700 | $65,600 | $226,100 |
| 2017 | $5,299 | $275,700 | $65,600 | $210,100 |
| 2016 | $5,431 | $263,500 | $53,800 | $209,700 |
| 2015 | $5,288 | $263,500 | $53,800 | $209,700 |
| 2014 | $5,121 | $262,100 | $53,800 | $208,300 |
Source: Public Records
Map
Nearby Homes
Your Personal Tour Guide
Ask me questions while you tour the home.