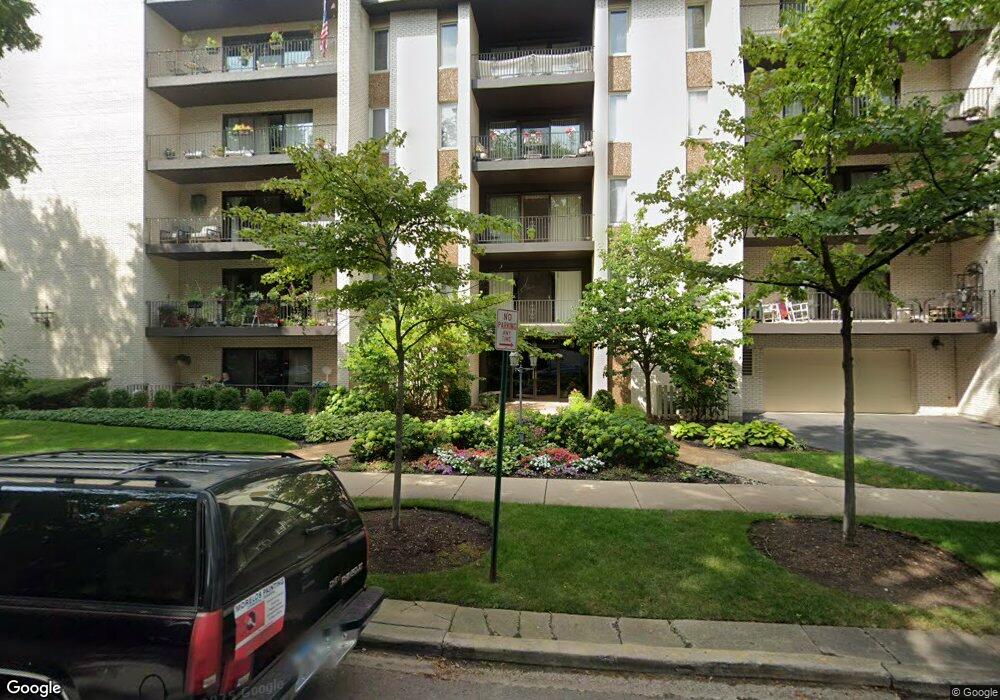
410 Ashland Ave Unit 2B River Forest, IL 60305
Estimated Value: $345,000 - $419,199
3
Beds
2
Baths
1,770
Sq Ft
$216/Sq Ft
Est. Value
About This Home
This home is located at 410 Ashland Ave Unit 2B, River Forest, IL 60305 and is currently estimated at $381,550, approximately $215 per square foot. 410 Ashland Ave Unit 2B is a home located in Cook County with nearby schools including Lincoln Elementary School, Roosevelt Middle School, and Oak Park and River Forest High School.
Ownership History
Date
Name
Owned For
Owner Type
Purchase Details
Closed on
Sep 13, 2023
Sold by
Huggins Brian and Huggins Kathleen J
Bought by
Brian D Hugins Living Trust and Kathleen Quinlan Living Trust
Current Estimated Value
Purchase Details
Closed on
Nov 3, 2017
Sold by
Mcgee Doris
Bought by
Huggins Brian D and Huggins Christine Q
Purchase Details
Closed on
Apr 28, 2010
Sold by
Kerwin Sylvester J and The Cecile B Kerwin Declaratio
Bought by
Mcgee Doris M
Home Financials for this Owner
Home Financials are based on the most recent Mortgage that was taken out on this home.
Original Mortgage
$237,120
Interest Rate
4.25%
Mortgage Type
Stand Alone Second
Purchase Details
Closed on
Sep 24, 1998
Sold by
Corus Bank Na
Bought by
Kerwin Cecile B and The Cecile B Kerwin Declaratio
Create a Home Valuation Report for This Property
The Home Valuation Report is an in-depth analysis detailing your home's value as well as a comparison with similar homes in the area
Home Values in the Area
Average Home Value in this Area
Purchase History
| Date | Buyer | Sale Price | Title Company |
|---|---|---|---|
| Brian D Hugins Living Trust | -- | None Listed On Document | |
| Huggins Brian D | $265,000 | Proper Title Llc | |
| Mcgee Doris M | $250,000 | Bt | |
| Kerwin Cecile B | -- | -- |
Source: Public Records
Mortgage History
| Date | Status | Borrower | Loan Amount |
|---|---|---|---|
| Previous Owner | Mcgee Doris M | $237,120 |
Source: Public Records
Tax History Compared to Growth
Tax History
| Year | Tax Paid | Tax Assessment Tax Assessment Total Assessment is a certain percentage of the fair market value that is determined by local assessors to be the total taxable value of land and additions on the property. | Land | Improvement |
|---|---|---|---|---|
| 2024 | $7,157 | $29,458 | $1,018 | $28,440 |
| 2023 | $5,873 | $29,458 | $1,018 | $28,440 |
| 2022 | $5,873 | $21,609 | $1,728 | $19,881 |
| 2021 | $5,684 | $21,608 | $1,728 | $19,880 |
| 2020 | $5,623 | $21,608 | $1,728 | $19,880 |
| 2019 | $5,687 | $21,749 | $1,562 | $20,187 |
| 2018 | $5,382 | $21,749 | $1,562 | $20,187 |
| 2017 | $6,369 | $21,749 | $1,562 | $20,187 |
| 2016 | $4,770 | $19,110 | $1,301 | $17,809 |
| 2015 | $4,618 | $19,110 | $1,301 | $17,809 |
| 2014 | $4,257 | $19,110 | $1,301 | $17,809 |
| 2013 | $5,106 | $20,727 | $1,301 | $19,426 |
Source: Public Records
Map
Nearby Homes
- 410 Ashland Ave Unit 1A
- 407 Ashland Ave Unit 3G
- 407 Ashland Ave Unit 5F
- 7541 Brown Ave Unit H
- 424 Park Ave Unit 206
- 213 Ashland Ave
- 103 Des Plaines Ave
- 111 Des Plaines Ave
- 133 Ashland Ave
- 435 William St Unit 205
- 7415 Dixon St
- 414 Clinton Place Unit 302
- 7911 Oak Ave
- 148 Circle Ave Unit 303
- 148 Circle Ave Unit 401
- 7449 Washington St Unit 606
- 314 Lathrop Ave Unit 507
- 314 Lathrop Ave Unit 502
- 115 Marengo Ave Unit 204
- 315 Des Plaines Ave Unit 506
- 410 Ashland Ave Unit 3E
- 410 Ashland Ave Unit 4E
- 410 Ashland Ave Unit 4A
- 410 Ashland Ave Unit 3D
- 410 Ashland Ave Unit 2E
- 410 Ashland Ave Unit 4D
- 410 Ashland Ave Unit 2C
- 410 Ashland Ave Unit 5F
- 410 Ashland Ave Unit 3B
- 410 Ashland Ave Unit 3A
- 410 Ashland Ave Unit 3G
- 410 Ashland Ave Unit 3F
- 410 Ashland Ave Unit 2D
- 410 Ashland Ave Unit 5B
- 410 Ashland Ave Unit 4F
- 410 Ashland Ave Unit 5A
- 410 Ashland Ave Unit 5C
- 410 Ashland Ave Unit 4C
- 410 Ashland Ave Unit 2G
- 410 Ashland Ave Unit 4G