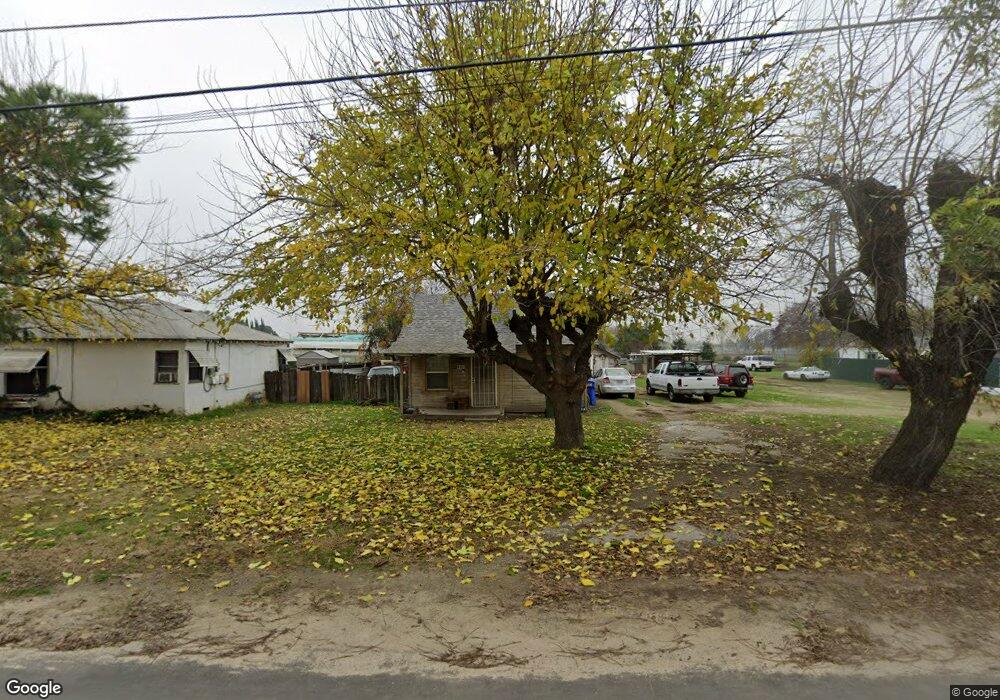
410 Bothun Rd Turlock, CA 95380
Estimated Value: $218,519 - $383,000
2
Beds
1
Bath
638
Sq Ft
$434/Sq Ft
Est. Value
About This Home
This home is located at 410 Bothun Rd, Turlock, CA 95380 and is currently estimated at $277,130, approximately $434 per square foot. 410 Bothun Rd is a home located in Stanislaus County with nearby schools including Julien Elementary School, Marvin A. Dutcher Middle School, and Turlock Junior High School.
Ownership History
Date
Name
Owned For
Owner Type
Purchase Details
Closed on
Sep 10, 2013
Sold by
Herrera Cabrini A
Bought by
Turlock Irrigation District
Current Estimated Value
Purchase Details
Closed on
Sep 11, 2012
Sold by
Herrera Cabrini A
Bought by
Turlock Irrigation District
Purchase Details
Closed on
Jul 2, 2009
Sold by
Herrera Cabrini A
Bought by
Herrera Cabrini A and Herrera Ralph J
Purchase Details
Closed on
Oct 11, 2007
Sold by
Herrera Ralph F
Bought by
Herrera Ralph Flores and Ralph Flores Herrera 2007 Revocable Trus
Create a Home Valuation Report for This Property
The Home Valuation Report is an in-depth analysis detailing your home's value as well as a comparison with similar homes in the area
Home Values in the Area
Average Home Value in this Area
Purchase History
| Date | Buyer | Sale Price | Title Company |
|---|---|---|---|
| Turlock Irrigation District | $290 | None Available | |
| Turlock Irrigation District | -- | None Available | |
| Herrera Cabrini A | -- | None Available | |
| Herrera Ralph Flores | -- | None Available |
Source: Public Records
Tax History Compared to Growth
Tax History
| Year | Tax Paid | Tax Assessment Tax Assessment Total Assessment is a certain percentage of the fair market value that is determined by local assessors to be the total taxable value of land and additions on the property. | Land | Improvement |
|---|---|---|---|---|
| 2025 | $377 | $31,109 | $15,934 | $15,175 |
| 2024 | $370 | $30,500 | $15,622 | $14,878 |
| 2023 | $369 | $29,903 | $15,316 | $14,587 |
| 2022 | $363 | $29,317 | $15,016 | $14,301 |
| 2021 | $361 | $28,743 | $14,722 | $14,021 |
| 2020 | $358 | $28,450 | $14,572 | $13,878 |
| 2019 | $353 | $27,893 | $14,287 | $13,606 |
| 2018 | $353 | $27,347 | $14,007 | $13,340 |
| 2017 | $346 | $26,812 | $13,733 | $13,079 |
| 2016 | $326 | $26,287 | $13,464 | $12,823 |
| 2015 | $322 | $25,893 | $13,262 | $12,631 |
| 2014 | $319 | $25,387 | $13,003 | $12,384 |
Source: Public Records
Map
Nearby Homes