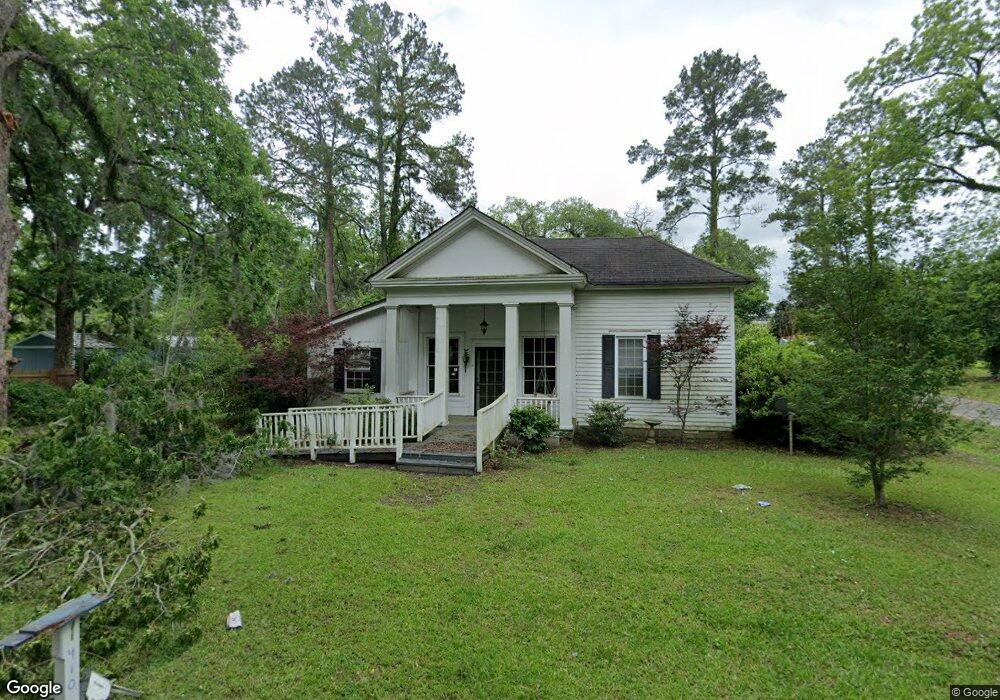
410 W Gordon St Quitman, GA 31643
Estimated Value: $69,000 - $110,177
3
Beds
2
Baths
1,436
Sq Ft
$65/Sq Ft
Est. Value
About This Home
This home is located at 410 W Gordon St, Quitman, GA 31643 and is currently estimated at $93,544, approximately $65 per square foot. 410 W Gordon St is a home located in Brooks County with nearby schools including Quitman Elementary School and First Baptist Church Preschool & Kindergarten.
Ownership History
Date
Name
Owned For
Owner Type
Purchase Details
Closed on
Mar 14, 2024
Sold by
United States Veterans Affairs
Bought by
A Plus Dia Mgmt Llc
Current Estimated Value
Purchase Details
Closed on
Sep 11, 2023
Sold by
Lakeview Loan Servicing Llc
Bought by
United States Veterans Affairs
Purchase Details
Closed on
Aug 1, 2023
Sold by
Atkins Steven C
Bought by
Lakeview Loan Servicing Llc
Purchase Details
Closed on
Jun 2, 2016
Sold by
Atkins Deborah Anne
Bought by
Atkins Steven Scott
Purchase Details
Closed on
Mar 28, 2011
Sold by
Stover Robert Bruce
Bought by
Atkins Deborah Anne and Atkins Steven C
Home Financials for this Owner
Home Financials are based on the most recent Mortgage that was taken out on this home.
Original Mortgage
$66,400
Interest Rate
4.92%
Mortgage Type
VA
Purchase Details
Closed on
Apr 24, 2009
Sold by
Copeland Ray A
Bought by
Stover Robert Bruce
Purchase Details
Closed on
Aug 5, 1998
Sold by
Copeland Thomas A
Bought by
Copeland Ora Belle
Create a Home Valuation Report for This Property
The Home Valuation Report is an in-depth analysis detailing your home's value as well as a comparison with similar homes in the area
Home Values in the Area
Average Home Value in this Area
Purchase History
| Date | Buyer | Sale Price | Title Company |
|---|---|---|---|
| A Plus Dia Mgmt Llc | $65,000 | -- | |
| United States Veterans Affairs | -- | -- | |
| Lakeview Loan Servicing Llc | $60,473 | -- | |
| Atkins Steven Scott | -- | -- | |
| Atkins Deborah Anne | $83,000 | -- | |
| Stover Robert Bruce | $65,000 | -- | |
| Copeland Ora Belle | -- | -- |
Source: Public Records
Mortgage History
| Date | Status | Borrower | Loan Amount |
|---|---|---|---|
| Previous Owner | Atkins Deborah Anne | $66,400 |
Source: Public Records
Tax History
| Year | Tax Paid | Tax Assessment Tax Assessment Total Assessment is a certain percentage of the fair market value that is determined by local assessors to be the total taxable value of land and additions on the property. | Land | Improvement |
|---|---|---|---|---|
| 2025 | $924 | $28,248 | $2,880 | $25,368 |
| 2024 | $966 | $29,528 | $4,160 | $25,368 |
| 2023 | $1,751 | $49,488 | $4,160 | $45,328 |
| 2022 | $1,605 | $45,368 | $5,280 | $40,088 |
| 2021 | $1,055 | $29,288 | $2,040 | $27,248 |
| 2020 | $1,033 | $29,288 | $2,040 | $27,248 |
| 2019 | $901 | $29,568 | $2,760 | $26,808 |
| 2018 | $1,090 | $29,968 | $2,760 | $27,208 |
| 2017 | $883 | $28,608 | $2,920 | $25,688 |
| 2016 | $826 | $29,008 | $2,920 | $26,088 |
| 2015 | -- | $28,728 | $2,920 | $25,808 |
| 2014 | -- | $29,128 | $2,920 | $26,208 |
| 2013 | -- | $29,128 | $2,920 | $26,208 |
Source: Public Records
Map
Nearby Homes
- 203 W Gordon St
- Lot 14 Dawn Ln
- 606 N Court St
- 1001 W Bartow St
- 700 N Washington St
- 0 E Gordon St
- 807 N Court St
- 0 W Swamp St
- 309 Eastlake Dr
- 506 Oglesby St
- 1501 W Screven St
- 103 Magnolia Dr
- 804 Westlake Dr
- 1306 E Screven St
- 714 Morris Ave
- 103 Victorian Way
- 0 Madison Hwy Unit 26460639
- 0 Madison Hwy Unit 147194
- 5036 Hamlin Rd
- 237 Turkey Ridge Ln
- 500 W Gordon St
- 407 W Lafayette St
- 402 W Gordon St
- 407 W Gordon St
- 405 W Gordon St
- 401 W Lafayette St
- 501 W Lafayette St
- 403 N Warren St
- 508 W Gordon St
- 501 W Gordon St
- 509 W Lafayette St
- 405 N Seymore St
- 315 W Lafayette St
- 410 N Warren St
- 509 W Gordon St
- 400 W Lafayette St
- 407 N Seymore St
- 308 N Walker St
- 410 N Seymore St
- 417 N Warren St
Your Personal Tour Guide
Ask me questions while you tour the home.