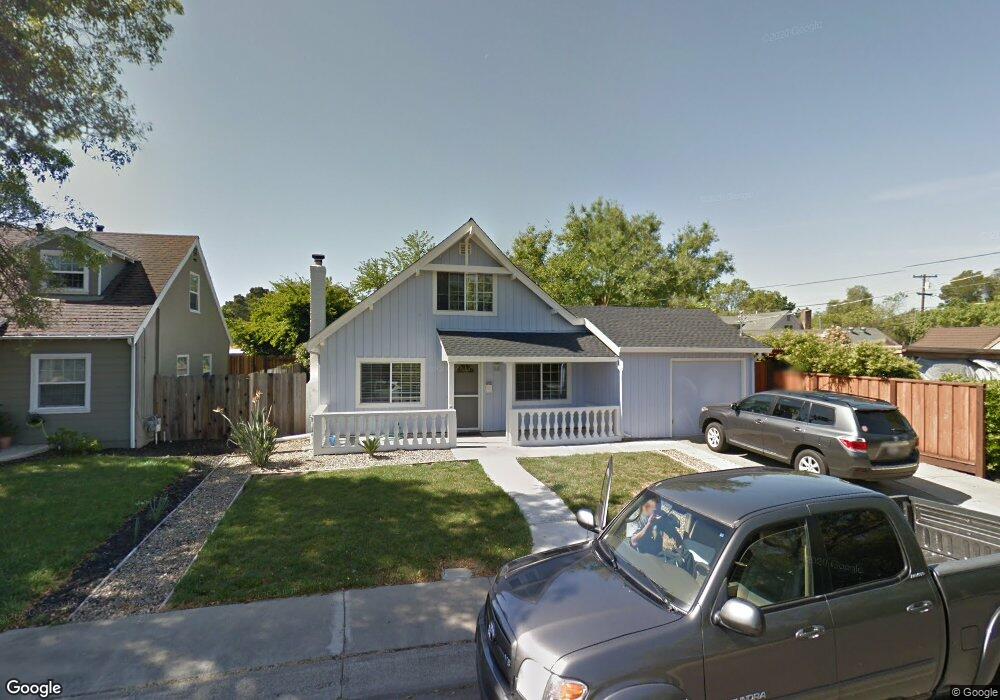
4108 Joan Ave Concord, CA 94521
Cowell/Canterbury NeighborhoodEstimated Value: $599,000 - $783,000
4
Beds
2
Baths
1,160
Sq Ft
$614/Sq Ft
Est. Value
About This Home
This home is located at 4108 Joan Ave, Concord, CA 94521 and is currently estimated at $712,668, approximately $614 per square foot. 4108 Joan Ave is a home located in Contra Costa County with nearby schools including El Monte Elementary School, El Dorado Middle School, and Concord High School.
Ownership History
Date
Name
Owned For
Owner Type
Purchase Details
Closed on
Feb 4, 2014
Sold by
Schilling Gina
Bought by
Schilling Gina and Schilling Darin
Current Estimated Value
Purchase Details
Closed on
Jan 27, 2014
Sold by
Schilling Gina
Bought by
Schilling Gina
Purchase Details
Closed on
May 8, 2012
Sold by
Bearse Jumidez A and Bearse Junie A
Bought by
Bearse Jumidez A
Create a Home Valuation Report for This Property
The Home Valuation Report is an in-depth analysis detailing your home's value as well as a comparison with similar homes in the area
Home Values in the Area
Average Home Value in this Area
Purchase History
| Date | Buyer | Sale Price | Title Company |
|---|---|---|---|
| Schilling Gina | -- | None Available | |
| Schilling Gina | -- | None Available | |
| Bearse Jumidez A | -- | None Available |
Source: Public Records
Tax History
| Year | Tax Paid | Tax Assessment Tax Assessment Total Assessment is a certain percentage of the fair market value that is determined by local assessors to be the total taxable value of land and additions on the property. | Land | Improvement |
|---|---|---|---|---|
| 2025 | $3,953 | $266,433 | $148,229 | $118,204 |
| 2024 | $3,751 | $261,210 | $145,323 | $115,887 |
| 2023 | $3,751 | $256,089 | $142,474 | $113,615 |
| 2022 | $3,684 | $251,069 | $139,681 | $111,388 |
| 2021 | $3,580 | $246,147 | $136,943 | $109,204 |
| 2019 | $3,501 | $238,848 | $132,882 | $105,966 |
| 2018 | $3,360 | $234,166 | $130,277 | $103,889 |
| 2017 | $3,237 | $229,575 | $127,723 | $101,852 |
| 2016 | $3,128 | $225,074 | $125,219 | $99,855 |
| 2015 | $3,070 | $221,695 | $123,339 | $98,356 |
| 2014 | $2,996 | $217,353 | $120,923 | $96,430 |
Source: Public Records
Map
Nearby Homes
- 4225 Sherwood Ct
- 4185 Huckleberry Dr
- 4081 Clayton Rd Unit 235
- 1420 Bel Air Dr Unit 208
- 1430 Bel Air Dr Unit 305
- 1430 Bel Air Dr Unit 103
- 1450 Bel Air Dr Unit 110
- 4044 Cowell Rd
- 3905 Clayton Rd Unit 37
- 3901 Clayton Rd Unit 25
- 4151 Storey Ln
- 1536 Lavetta Way
- 1579 West St
- 4024 Salem St
- 4130 Storey Ln
- 4063 Salem St
- 4204 Dubhe Ct
- 1579 Farm Bureau Rd
- 3959 Chestnut Ave
- 4317 Cowell Rd
- 4114 Joan Ave
- 1382 Cape Cod Way
- 1386 Cape Cod Way
- 4120 Joan Ave
- 1383 Cobblestone Ct
- 1378 Cape Cod Way
- 4105 Joan Ave
- 4109 Joan Ave
- 4126 Joan Ave
- 4115 Joan Ave
- 1377 Cobblestone Ct
- 4121 Joan Ave
- 4132 Joan Ave
- 1370 Cape Cod Way
- 1381 Cape Cod Way
- 1377 Cape Cod Way
- 1373 Cape Cod Way
- 1376 Cobblestone Ct
- 4098 Joan Ave
- 4127 Joan Ave
Your Personal Tour Guide
Ask me questions while you tour the home.