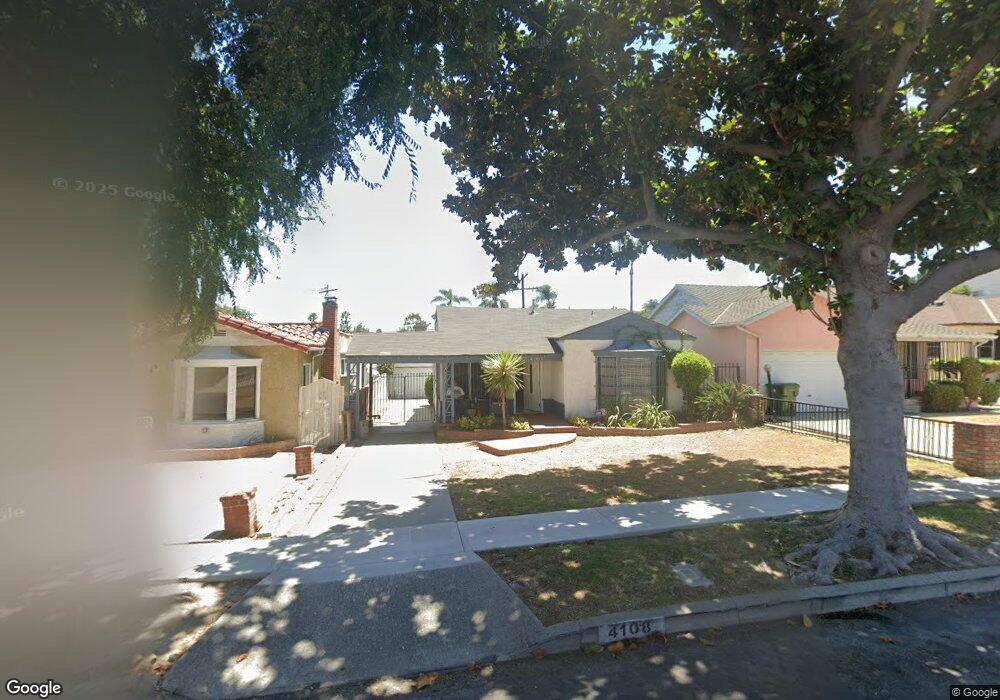
4108 W 59th Place Los Angeles, CA 90043
Hyde Park NeighborhoodEstimated Value: $741,000 - $1,067,000
3
Beds
2
Baths
968
Sq Ft
$917/Sq Ft
Est. Value
About This Home
This home is located at 4108 W 59th Place, Los Angeles, CA 90043 and is currently estimated at $887,446, approximately $916 per square foot. 4108 W 59th Place is a home located in Los Angeles County with nearby schools including Fifty-Fourth Street Elementary School, Audubon Middle School, and Crenshaw Science, Technology, Engineering, Math And Medicine Magnet.
Ownership History
Date
Name
Owned For
Owner Type
Purchase Details
Closed on
Apr 13, 2006
Sold by
Palmer Ingrid
Bought by
Palmer Iris C and Palmer Ingrid F
Current Estimated Value
Purchase Details
Closed on
Sep 8, 2000
Sold by
Andrews Toshawa
Bought by
Andrews Kent
Home Financials for this Owner
Home Financials are based on the most recent Mortgage that was taken out on this home.
Original Mortgage
$183,200
Outstanding Balance
$66,107
Interest Rate
7.96%
Estimated Equity
$821,339
Purchase Details
Closed on
Sep 5, 2000
Sold by
Andrews Kent
Bought by
Palmer Henry B
Home Financials for this Owner
Home Financials are based on the most recent Mortgage that was taken out on this home.
Original Mortgage
$183,200
Outstanding Balance
$66,107
Interest Rate
7.96%
Estimated Equity
$821,339
Purchase Details
Closed on
Sep 6, 1996
Sold by
Andrews Kent
Bought by
Andrews Kent
Create a Home Valuation Report for This Property
The Home Valuation Report is an in-depth analysis detailing your home's value as well as a comparison with similar homes in the area
Home Values in the Area
Average Home Value in this Area
Purchase History
| Date | Buyer | Sale Price | Title Company |
|---|---|---|---|
| Palmer Iris C | -- | None Available | |
| Andrews Kent | -- | Equity Title | |
| Palmer Henry B | $229,000 | Equity Title Company | |
| Andrews Kent | -- | -- |
Source: Public Records
Mortgage History
| Date | Status | Borrower | Loan Amount |
|---|---|---|---|
| Open | Palmer Henry B | $183,200 |
Source: Public Records
Tax History Compared to Growth
Tax History
| Year | Tax Paid | Tax Assessment Tax Assessment Total Assessment is a certain percentage of the fair market value that is determined by local assessors to be the total taxable value of land and additions on the property. | Land | Improvement |
|---|---|---|---|---|
| 2025 | $4,492 | $345,044 | $194,371 | $150,673 |
| 2024 | $4,492 | $338,279 | $190,560 | $147,719 |
| 2023 | $4,411 | $331,647 | $186,824 | $144,823 |
| 2022 | $4,219 | $325,145 | $183,161 | $141,984 |
| 2021 | $4,161 | $318,770 | $179,570 | $139,200 |
| 2019 | $4,041 | $309,317 | $174,245 | $135,072 |
| 2018 | $3,959 | $303,253 | $170,829 | $132,424 |
| 2016 | $3,783 | $291,480 | $164,197 | $127,283 |
| 2015 | $3,727 | $287,103 | $161,731 | $125,372 |
| 2014 | $3,743 | $281,480 | $158,563 | $122,917 |
Source: Public Records
Map
Nearby Homes
- 4137 W 58th Place
- 4254 W 58th Place
- 4263 W 59th St
- 4243 W 58th Place
- 4313 W 59th St
- 4210 W 62nd St
- 5659 Valley Glen Way
- 4325 W 58th Place
- 4329 W 58th Place
- 4408 W 59th St
- 3854 W 59th St
- 5709 Alviso Ave
- 4104 Charlene Dr
- 3831 W 60th St
- 4440 W 58th Place
- 3961 W 64th St
- 3815 W 60th St
- 6018 S Harcourt Ave
- 3932 W 64th St
- 612 E Fairview Blvd
- 4104 W 59th Place
- 4112 W 59th Place
- 4100 W 59th Place
- 4116 W 59th Place
- 4120 W 59th Place
- 4109 W 60th St
- 4105 W 60th St
- 4111 W 60th St
- 4117 W 60th St
- 4124 W 59th Place
- 5950 S Verdun Ave
- 4121 W 60th St
- 4107 W 59th Place
- 4113 W 59th Place
- 4105 W 59th Place
- 4128 W 59th Place
- 4117 W 59th Place
- 4062 W 59th Place
- 5925 S Verdun Ave
- 5974 S Verdun Ave