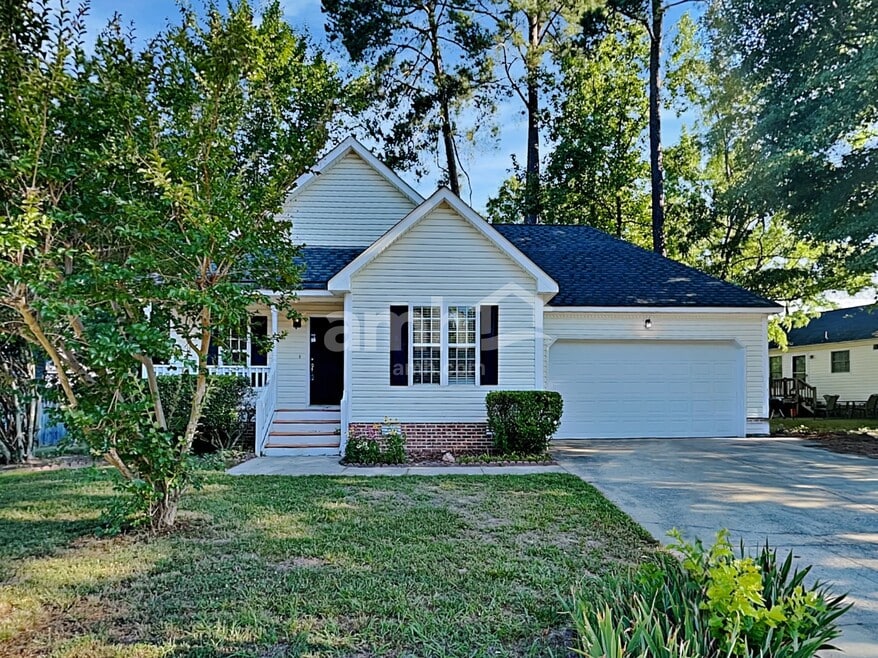
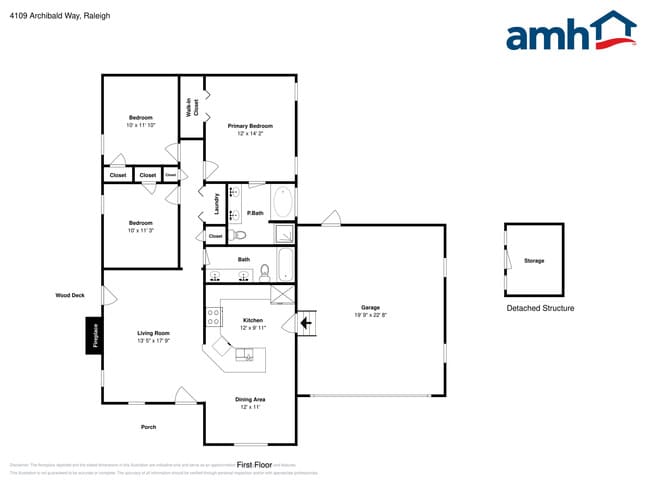
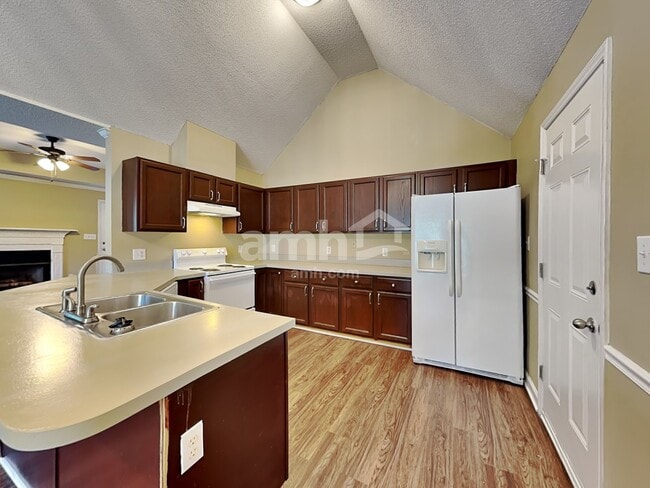
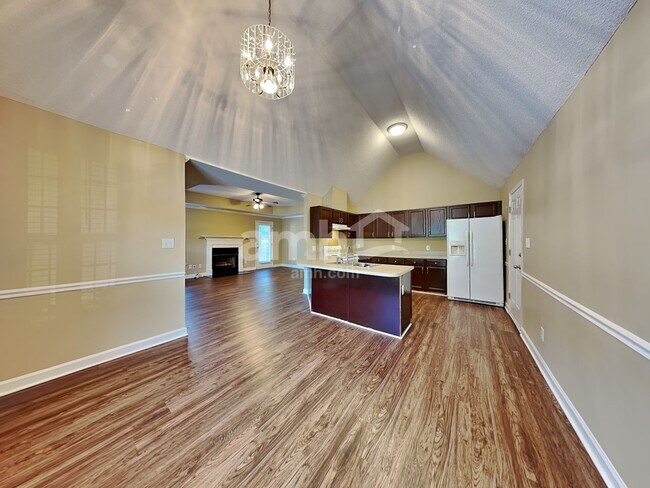
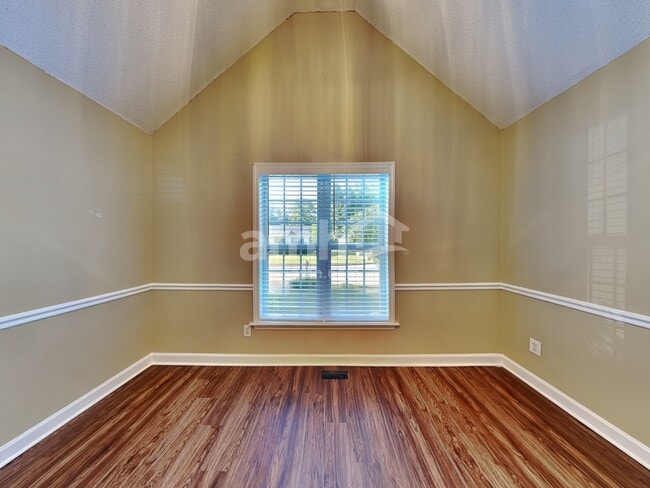
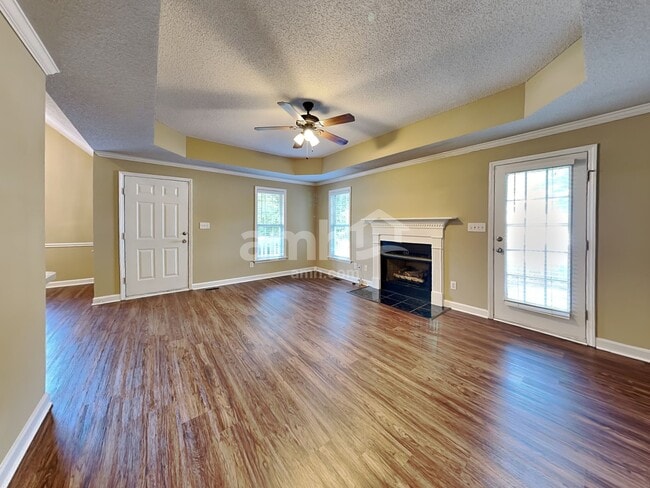
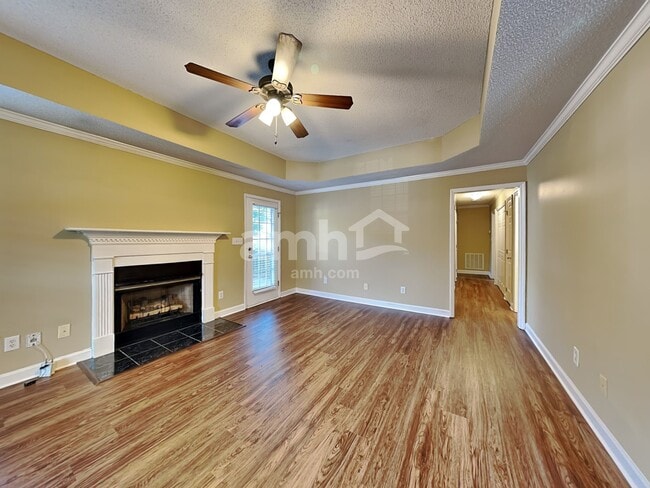
4109 Archibald Way Raleigh, NC 27616
Forestville NeighborhoodAbout This Home
Special offer: Pay just 50% of your base rent (taxes and fees not included) as your security deposit, valid for new applicants who sign a 12-month lease by December 31, 2025. Offer is contingent on application approval and execution of a lease agreement. Other terms and conditions may apply. This property is professionally managed by AMH, a leading single-family rental company. We expect to make this property available for showings soon. We work to simplify your rental experience by offering self-guided tours and a streamlined leasing process you can complete all online, all on your own schedule. Once moved in, we provide maintenance support that you can rely on, so you can enjoy your weekends stress-free. We look forward to welcoming you home! Utilities, taxes, and other fees may apply. Please verify and confirm all information before signing a lease. If you have questions, don’t hesitate to contact us at the telephone number on this property listing. All lease applications, documentation, and initial payments for this property, must be submitted directly through or by phone. The photos, renderings, or other images of the properties on our website, are for illustrative purposes only, and may vary from the features, amenities, or phase of construction. We do not advertise properties on Craigslist, Facebook Marketplace, or other classified advertising websites. If you believe one of our residences is listed there, please notify us. For further description of applicable fees, please go to our website.

Map
- 4809 Hallam Way
- 4420 Archibald Way
- 7313 Jacqueline Ln
- 4610 Jacqueline Ln
- 4700 Draper Rd
- 4616 Draper Rd
- 6923 Fox Haven Place
- 8147 Mcguire Dr
- 7205 Beaverwood Dr
- 8160 Mcguire Dr
- 7329 Bassett Hall Ct
- 8218 Merriweather Cir
- 8250 Mcguire Dr
- 7317 Fox Rd
- 7209 Pinewood Ln
- 4828 Bivens Dr
- 8341 Wynewood Ct
- 5208 Botany Bay Dr
- 6900 Whittlesea Place
- 2873 Springtooth Dr
- 6701 Fox Rd
- 7901 Cheaha Dr
- 4730 Archean Way
- 7021 Fox Haven Place
- 7901 Cheaha Dr Unit B1
- 7901 Cheaha Dr Unit A2
- 7901 Cheaha Dr Unit C1
- 7019 Beaverwood Dr
- 8112 Farmlea Cir
- 8102 Farmlea Cir
- 8182 Mcguire Dr
- 8184 Mcguire Dr
- 8122 Mcguire Dr
- 7880 Triangle Promenade Dr
- 6601 Roxboro St
- 6525 Mezzo Ln
- 7100 Homestead Heights Ln
- 3901 Capital Hills Dr Unit B1A
- 3901 Capital Hills Dr Unit C1a
- 3901 Capital Hills Dr Unit A1