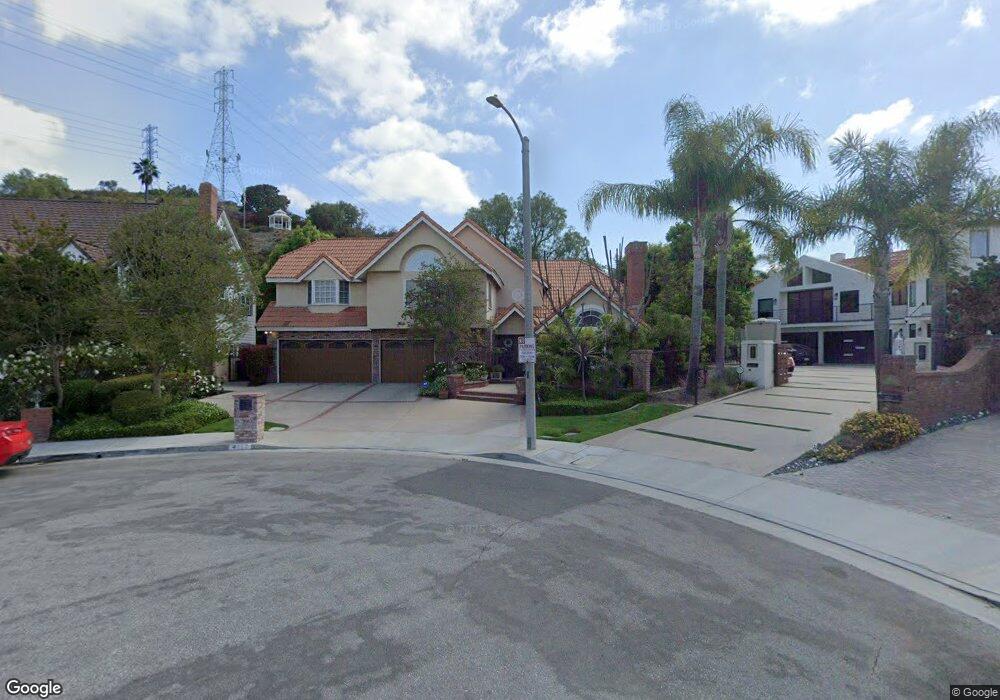
4109 E Rolling Green Ln Orange, CA 92867
Estimated Value: $2,259,266 - $3,042,000
5
Beds
4
Baths
4,376
Sq Ft
$595/Sq Ft
Est. Value
About This Home
This home is located at 4109 E Rolling Green Ln, Orange, CA 92867 and is currently estimated at $2,603,067, approximately $594 per square foot. 4109 E Rolling Green Ln is a home located in Orange County with nearby schools including Serrano Elementary School, Cerro Villa Middle School, and Villa Park High School.
Ownership History
Date
Name
Owned For
Owner Type
Purchase Details
Closed on
Oct 27, 2004
Sold by
Gartman Richard R and Peniche Gartman Laurel
Bought by
Gartman Richard R and Peniche Gartman Laurel
Current Estimated Value
Purchase Details
Closed on
Mar 2, 1999
Sold by
Thomas Mccracken and Thomas Laurie
Bought by
Gartman Richard and Gartman Laurel A Peniche
Home Financials for this Owner
Home Financials are based on the most recent Mortgage that was taken out on this home.
Original Mortgage
$500,500
Interest Rate
6.86%
Purchase Details
Closed on
Oct 19, 1994
Sold by
Greenberg Harry and Greenberg Alayne
Bought by
Mccracken Thomas B and Mccracken Laurie
Home Financials for this Owner
Home Financials are based on the most recent Mortgage that was taken out on this home.
Original Mortgage
$444,000
Interest Rate
7.87%
Create a Home Valuation Report for This Property
The Home Valuation Report is an in-depth analysis detailing your home's value as well as a comparison with similar homes in the area
Home Values in the Area
Average Home Value in this Area
Purchase History
| Date | Buyer | Sale Price | Title Company |
|---|---|---|---|
| Gartman Richard R | -- | -- | |
| Gartman Richard R | -- | -- | |
| Gartman Richard | $715,000 | Chicago Title Co | |
| Mccracken Thomas B | $555,000 | Old Republic Title Company |
Source: Public Records
Mortgage History
| Date | Status | Borrower | Loan Amount |
|---|---|---|---|
| Previous Owner | Gartman Richard | $500,500 | |
| Previous Owner | Mccracken Thomas B | $444,000 | |
| Closed | Mccracken Thomas B | $55,500 |
Source: Public Records
Tax History
| Year | Tax Paid | Tax Assessment Tax Assessment Total Assessment is a certain percentage of the fair market value that is determined by local assessors to be the total taxable value of land and additions on the property. | Land | Improvement |
|---|---|---|---|---|
| 2025 | $11,995 | $1,126,419 | $599,300 | $527,119 |
| 2024 | $11,995 | $1,104,333 | $587,549 | $516,784 |
| 2023 | $11,732 | $1,082,680 | $576,029 | $506,651 |
| 2022 | $11,507 | $1,061,451 | $564,734 | $496,717 |
| 2021 | $11,181 | $1,040,639 | $553,661 | $486,978 |
| 2020 | $11,078 | $1,029,969 | $547,984 | $481,985 |
| 2019 | $10,934 | $1,009,774 | $537,239 | $472,535 |
| 2018 | $10,765 | $989,975 | $526,705 | $463,270 |
| 2017 | $10,309 | $970,564 | $516,377 | $454,187 |
| 2016 | $10,107 | $951,534 | $506,252 | $445,282 |
| 2015 | $9,960 | $937,242 | $498,648 | $438,594 |
| 2014 | $9,746 | $918,883 | $488,880 | $430,003 |
Source: Public Records
Map
Nearby Homes
- 4204 E Townsend Ave
- 2686 N Meredith St
- 18782 Peppertree Dr
- 9531 Lemon St
- 9451 Brewer Way
- 18262 Pamela Place
- 9312 Smoketree Ln
- 2796 N Meredith St
- 2811 N Roxbury St
- 2533 N Shady Forest Ln
- 18811 Ridgeview Cir
- 18411 Hillcrest Ave
- 2772 N Blackburn Dr Unit A
- 640 S Londerry Ln
- 3105 E Blueridge Ave
- 18221 Windsor Dr
- 19272 Mesa Dr
- 18301 Churchill Ln
- 240 S Orange Acres Dr
- 18801 Santiago Blvd
- 4117 E Rolling Green Ln
- 4045 E Rolling Green Ln
- 4119 E Rolling Green Ln
- 4110 E Rolling Green Ln
- 4116 E Rolling Green Ln
- 4027 E Rolling Green Ln
- 4118 E Rolling Green Ln
- 4038 E Rolling Green Ln
- 4104 E Rolling Green Ln
- 4017 E Rolling Green Ln
- 4235 E Cerro Villa Dr
- 4022 E Rolling Green Ln
- 4005 E Rolling Green Ln
- 4012 E Rolling Green Ln
- 4247 E Cerro Villa Dr
- 3948 E Rolling Green Ln
- 3945 E Rolling Green Ln
- 18541 Rosenau Dr
- 18551 Rosenau Dr
- 4039 E Green Clover Cir
Your Personal Tour Guide
Ask me questions while you tour the home.