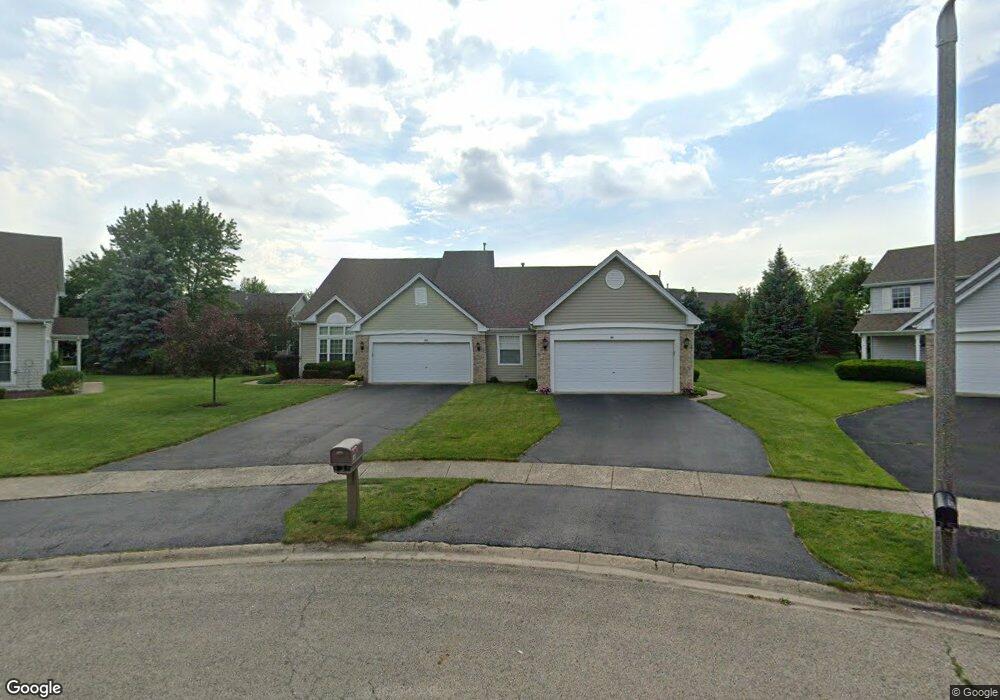
411 Carriage Ct Unit 1 Oswego, IL 60543
South Oswego NeighborhoodEstimated Value: $305,000 - $474,000
3
Beds
2
Baths
1,346
Sq Ft
$259/Sq Ft
Est. Value
About This Home
This home is located at 411 Carriage Ct Unit 1, Oswego, IL 60543 and is currently estimated at $348,790, approximately $259 per square foot. 411 Carriage Ct Unit 1 is a home located in Kendall County with nearby schools including Prairie Point Elementary School, Traughber Junior High School, and Oswego High School.
Ownership History
Date
Name
Owned For
Owner Type
Purchase Details
Closed on
Sep 30, 2011
Sold by
Cervenka Laura
Bought by
Cervenka Laura
Current Estimated Value
Purchase Details
Closed on
May 17, 2002
Sold by
Chmielewski Amy M and Nestor Gail F
Bought by
Cervenka Michael R and Cervenka Laura S
Home Financials for this Owner
Home Financials are based on the most recent Mortgage that was taken out on this home.
Original Mortgage
$148,200
Outstanding Balance
$62,667
Interest Rate
6.95%
Estimated Equity
$286,123
Purchase Details
Closed on
Jul 11, 1997
Sold by
The Old Second National Bank Of Aurora
Bought by
Chmielewski Florence
Home Financials for this Owner
Home Financials are based on the most recent Mortgage that was taken out on this home.
Original Mortgage
$20,000
Interest Rate
7.7%
Create a Home Valuation Report for This Property
The Home Valuation Report is an in-depth analysis detailing your home's value as well as a comparison with similar homes in the area
Home Values in the Area
Average Home Value in this Area
Purchase History
| Date | Buyer | Sale Price | Title Company |
|---|---|---|---|
| Cervenka Laura | -- | None Available | |
| Cervenka Michael R | $156,000 | Ticor Title Insurance Compan | |
| Chmielewski Florence | $131,000 | Ticor Title Insurance Compan |
Source: Public Records
Mortgage History
| Date | Status | Borrower | Loan Amount |
|---|---|---|---|
| Open | Cervenka Michael R | $148,200 | |
| Previous Owner | Chmielewski Florence | $20,000 |
Source: Public Records
Tax History Compared to Growth
Tax History
| Year | Tax Paid | Tax Assessment Tax Assessment Total Assessment is a certain percentage of the fair market value that is determined by local assessors to be the total taxable value of land and additions on the property. | Land | Improvement |
|---|---|---|---|---|
| 2024 | $4,934 | $83,163 | $14,769 | $68,394 |
| 2023 | $4,998 | $72,316 | $12,843 | $59,473 |
| 2022 | $4,998 | $66,345 | $11,783 | $54,562 |
| 2021 | $4,940 | $63,793 | $11,330 | $52,463 |
| 2020 | $5,285 | $61,935 | $11,000 | $50,935 |
| 2019 | $5,419 | $62,449 | $11,000 | $51,449 |
| 2018 | $5,036 | $58,047 | $14,544 | $43,503 |
| 2017 | $4,869 | $53,500 | $13,405 | $40,095 |
| 2016 | $4,650 | $50,711 | $12,706 | $38,005 |
| 2015 | $4,564 | $47,841 | $11,987 | $35,854 |
| 2014 | -- | $46,448 | $11,638 | $34,810 |
| 2013 | -- | $46,918 | $11,756 | $35,162 |
Source: Public Records
Map
Nearby Homes
- 371 S Madison St
- 616 Briarwood Ln
- 395 Danforth Dr
- 206 E Washington St
- 714 Pinehurst Ln
- 114 Riverview Ct
- 5161 US Highway 34
- 613 Murdock Place
- 388 Danforth Dr
- 423 Hathaway Ln
- 610 Murdock Place
- 611 Murdock Place
- 421 Hathaway Ln
- 315 White Pines Ln
- 5055 U S 34
- 177 Franklin St
- 55 Garfield St
- 34 N Adams St
- 101 Bell Ct
- 639 Vista Dr
- 409 Carriage Ct Unit 1
- 415 Carriage Ct Unit 1
- 415 Carriage Ct
- 517 Northgate Cir
- 515 Northgate Cir
- 407 Carriage Ct
- 519 Northgate Cir Unit 1
- 413 Carriage Ct Unit 1
- 513 Northgate Cir
- 414 Carriage Ct Unit 1
- 511 Northgate Cir
- 521 Northgate Cir
- 521 Northgate Cir Unit 2
- 405 Carriage Ct Unit 1
- 412 Carriage Ct Unit 1
- 509 Northgate Cir
- 403 Carriage Ct
- 523 Northgate Cir
- 507 Northgate Cir
- 410 Carriage Ct