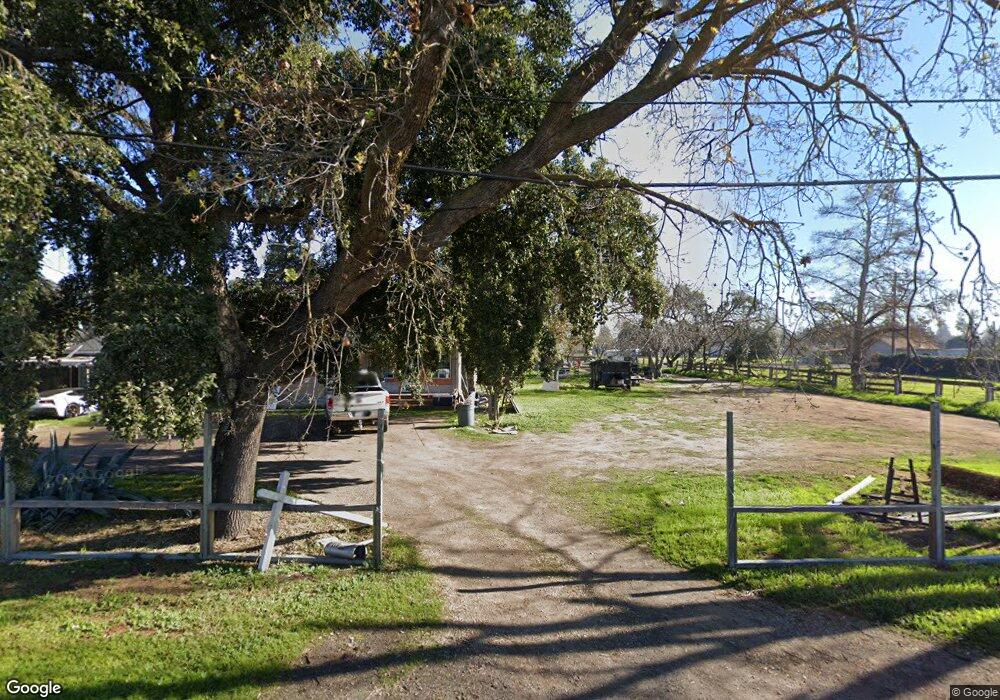
4114 Hubbard Rd Stockton, CA 95215
Estimated Value: $501,000 - $680,000
3
Beds
1
Bath
1,508
Sq Ft
$405/Sq Ft
Est. Value
About This Home
This home is located at 4114 Hubbard Rd, Stockton, CA 95215 and is currently estimated at $610,322, approximately $404 per square foot. 4114 Hubbard Rd is a home located in San Joaquin County with nearby schools including Waverly Elementary School and Linden High School.
Ownership History
Date
Name
Owned For
Owner Type
Purchase Details
Closed on
Dec 4, 2003
Sold by
Strain Kirsten Laughlin
Bought by
Alaniz Manuel M and Alaniz Maricela
Current Estimated Value
Home Financials for this Owner
Home Financials are based on the most recent Mortgage that was taken out on this home.
Original Mortgage
$299,250
Outstanding Balance
$140,118
Interest Rate
6.03%
Mortgage Type
Unknown
Estimated Equity
$470,204
Purchase Details
Closed on
Aug 13, 1998
Sold by
Strain Kevin R
Bought by
Strain Kirsten Laughlin
Purchase Details
Closed on
Mar 21, 1995
Sold by
Brandstad Jon E and Brandstad Christine D
Bought by
Laughlin Kirsten
Home Financials for this Owner
Home Financials are based on the most recent Mortgage that was taken out on this home.
Original Mortgage
$166,500
Interest Rate
8.9%
Create a Home Valuation Report for This Property
The Home Valuation Report is an in-depth analysis detailing your home's value as well as a comparison with similar homes in the area
Home Values in the Area
Average Home Value in this Area
Purchase History
| Date | Buyer | Sale Price | Title Company |
|---|---|---|---|
| Alaniz Manuel M | $315,000 | Fidelity Natl Title Ins Co | |
| Strain Kirsten Laughlin | -- | Fidelity National Title Co | |
| Laughlin Kirsten | $185,000 | Chicago Title Company |
Source: Public Records
Mortgage History
| Date | Status | Borrower | Loan Amount |
|---|---|---|---|
| Open | Alaniz Manuel M | $299,250 | |
| Previous Owner | Laughlin Kirsten | $166,500 |
Source: Public Records
Tax History Compared to Growth
Tax History
| Year | Tax Paid | Tax Assessment Tax Assessment Total Assessment is a certain percentage of the fair market value that is determined by local assessors to be the total taxable value of land and additions on the property. | Land | Improvement |
|---|---|---|---|---|
| 2025 | $6,231 | $447,841 | $234,583 | $213,258 |
| 2024 | $6,054 | $439,061 | $229,984 | $209,077 |
| 2023 | $5,125 | $430,453 | $225,475 | $204,978 |
| 2022 | $5,790 | $422,013 | $221,054 | $200,959 |
| 2021 | $4,947 | $413,739 | $216,720 | $197,019 |
| 2020 | $5,000 | $409,497 | $214,498 | $194,999 |
| 2019 | $5,425 | $401,469 | $210,293 | $191,176 |
| 2018 | $4,432 | $393,598 | $206,170 | $187,428 |
| 2017 | $4,701 | $385,881 | $202,128 | $183,753 |
| 2016 | $4,863 | $378,315 | $198,165 | $180,150 |
| 2014 | $4,553 | $365,334 | $191,365 | $173,969 |
Source: Public Records
Map
Nearby Homes
- 4350 Cherokee Rd Unit 33
- 4350 Cherokee Rd Unit 42
- 0 Towers Place
- 3431 N Cherryland Ave Unit 50
- 3431 N Cherryland Ave Unit 55
- 3514 N Cherryland Ave
- 3616 Towers Place
- 4900 N Highway 99 Unit 106
- 4900 N Highway 99 Unit 65
- 4900 N Highway 99 Unit 190
- 4900 N Highway 99 Unit 56
- 4900 N 99 Frontage Rd Unit 232
- 4987 Veronica St
- 5100 Hwy 99 Unit 128
- 5835 Cherokee Rd Unit 61
- 5835 Cherokee Rd Unit 41
- 5835 Cherokee Rd Unit 7
- 5100 N Highway 99 Unit 8
- 5100 N Highway 99 Unit 83
- 5100 N Highway 99 Unit 141
- 4032 Hubbard Rd
- 4162 Hubbard Rd
- 4202 Hubbard Rd
- 4107 Hubbard Rd
- 4127 Hubbard Rd
- 4016 Hubbard Rd
- 4143 Hubbard Rd
- 4228 Hubbard Rd
- 4232 Hubbard Rd
- 4039 Hubbard Rd
- 3938 Hubbard Rd
- 4015 Hubbard Rd
- 4219 Hubbard Rd
- 4252 Hubbard Rd
- 4141 N Cherryland Ave
- 4221 Hubbard Rd
- 3924 Hubbard Rd
- 3993 Hubbard Rd
- 4247 Hubbard Rd
- 4121 N Cherryland Ave