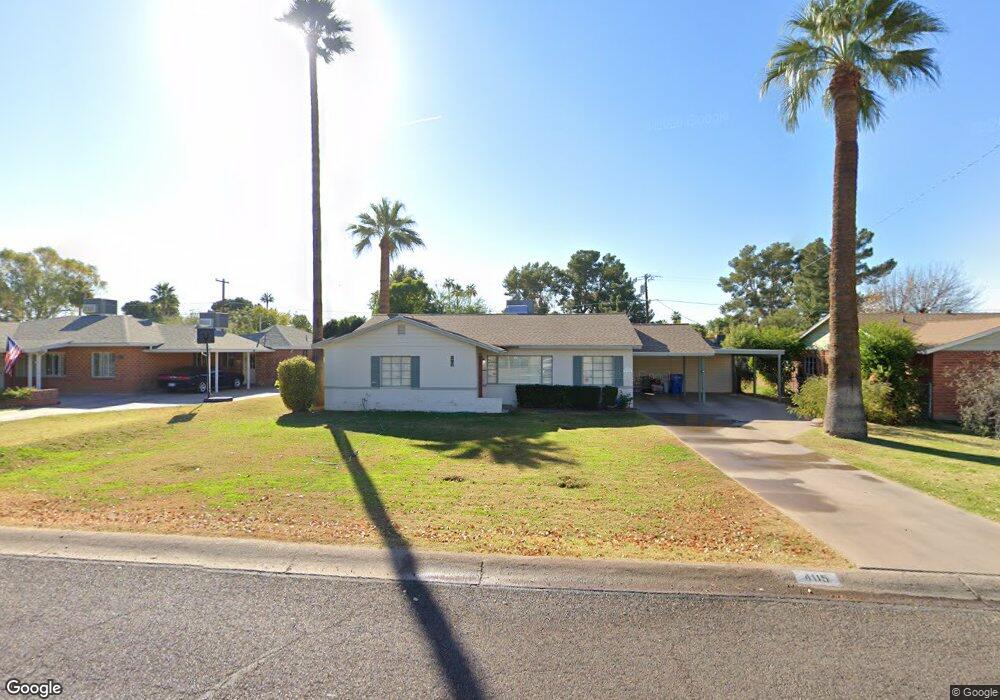
4115 E Windsor Ave Phoenix, AZ 85008
Camelback East Village NeighborhoodEstimated Value: $1,832,000 - $2,165,921
5
Beds
2
Baths
6,023
Sq Ft
$327/Sq Ft
Est. Value
About This Home
This home is located at 4115 E Windsor Ave, Phoenix, AZ 85008 and is currently estimated at $1,971,730, approximately $327 per square foot. 4115 E Windsor Ave is a home located in Maricopa County with nearby schools including Griffith Elementary School, Camelback High School, and Phoenix Coding Academy.
Ownership History
Date
Name
Owned For
Owner Type
Purchase Details
Closed on
Oct 6, 2025
Sold by
Trails End Cabins Llc
Bought by
Sandahl Living Trust and Sandahl
Current Estimated Value
Purchase Details
Closed on
Jul 12, 2024
Sold by
Hendrickson Paula and Carr Paula
Bought by
Trails End Cabins Llc
Home Financials for this Owner
Home Financials are based on the most recent Mortgage that was taken out on this home.
Original Mortgage
$850,000
Interest Rate
7.03%
Mortgage Type
New Conventional
Purchase Details
Closed on
Jul 23, 2001
Sold by
Hendrickson Zachary
Bought by
Hendrickson Paula
Purchase Details
Closed on
Jul 2, 2001
Sold by
Doretti David L and Dave L Doretti Family Trust
Bought by
Hendrickson Paula
Purchase Details
Closed on
Jun 7, 2001
Sold by
Cooper Charles
Bought by
Doretti David L
Purchase Details
Closed on
Jun 30, 1997
Sold by
Griffith Ruth F
Bought by
Griffith Ruth F
Create a Home Valuation Report for This Property
The Home Valuation Report is an in-depth analysis detailing your home's value as well as a comparison with similar homes in the area
Home Values in the Area
Average Home Value in this Area
Purchase History
| Date | Buyer | Sale Price | Title Company |
|---|---|---|---|
| Sandahl Living Trust | -- | Accommodation/Courtesy Recordi | |
| Trails End Cabins Llc | $560,625 | Pioneer Title Agency | |
| Hendrickson Paula | -- | Security Title Agency | |
| Hendrickson Paula | $155,500 | Security Title Agency | |
| Doretti David L | $108,000 | Security Title Agency | |
| Griffith Ruth F | -- | -- |
Source: Public Records
Mortgage History
| Date | Status | Borrower | Loan Amount |
|---|---|---|---|
| Previous Owner | Trails End Cabins Llc | $850,000 |
Source: Public Records
Tax History
| Year | Tax Paid | Tax Assessment Tax Assessment Total Assessment is a certain percentage of the fair market value that is determined by local assessors to be the total taxable value of land and additions on the property. | Land | Improvement |
|---|---|---|---|---|
| 2025 | $2,739 | $21,467 | -- | -- |
| 2024 | $2,231 | $20,444 | -- | -- |
| 2023 | $2,231 | $41,670 | $8,330 | $33,340 |
| 2022 | $2,144 | $32,180 | $6,430 | $25,750 |
| 2021 | $2,208 | $29,510 | $5,900 | $23,610 |
| 2020 | $2,165 | $27,230 | $5,440 | $21,790 |
| 2019 | $2,161 | $27,170 | $5,430 | $21,740 |
| 2018 | $2,022 | $22,480 | $4,490 | $17,990 |
| 2017 | $1,931 | $20,780 | $4,150 | $16,630 |
| 2016 | $1,889 | $21,920 | $4,380 | $17,540 |
| 2015 | $1,779 | $18,730 | $3,740 | $14,990 |
Source: Public Records
Map
Nearby Homes
- 4101 E Edgemont Ave
- 4213 E Edgemont Ave
- 4217 E Edgemont Ave
- 4208 E Wilshire Dr
- 4015 E Catalina Dr
- 4110 E Catalina Dr
- 4107 E Avalon Dr
- 2315 N 42nd St
- 4024 E Oak St
- 3001 N 43rd Place
- 3930 E Oak St
- 4307 E Avalon Dr
- 2923 N 38th St
- 3033 N 39th St Unit 4
- 3813 E Vernon Ave
- 2231 N 38th Way
- 3729 E Yale St
- 2989 N 44th St Unit 2023
- 2989 N 44th St Unit 3018
- 2989 N 44th St Unit 2039
- 4113 E Windsor Ave
- 4107 E Windsor Ave Unit <LOOK
- 4107 E Windsor Ave
- 4121 E Windsor Ave
- 4101 E Windsor Ave
- 4110 E Cambridge Ave
- 4127 E Windsor Ave
- 4108 E Cambridge Ave
- 4114 E Windsor Ave
- 4118 E Cambridge Ave
- 4108 E Windsor Ave
- 4122 E Windsor Ave
- 4102 E Cambridge Ave
- 4045 E Windsor Ave
- 4102 E Windsor Ave
- 4126 E Cambridge Ave
- 4128 E Windsor Ave
- 4133 E Windsor Ave
- 4046 E Cambridge Ave
- 4054 E Windsor Ave
Your Personal Tour Guide
Ask me questions while you tour the home.