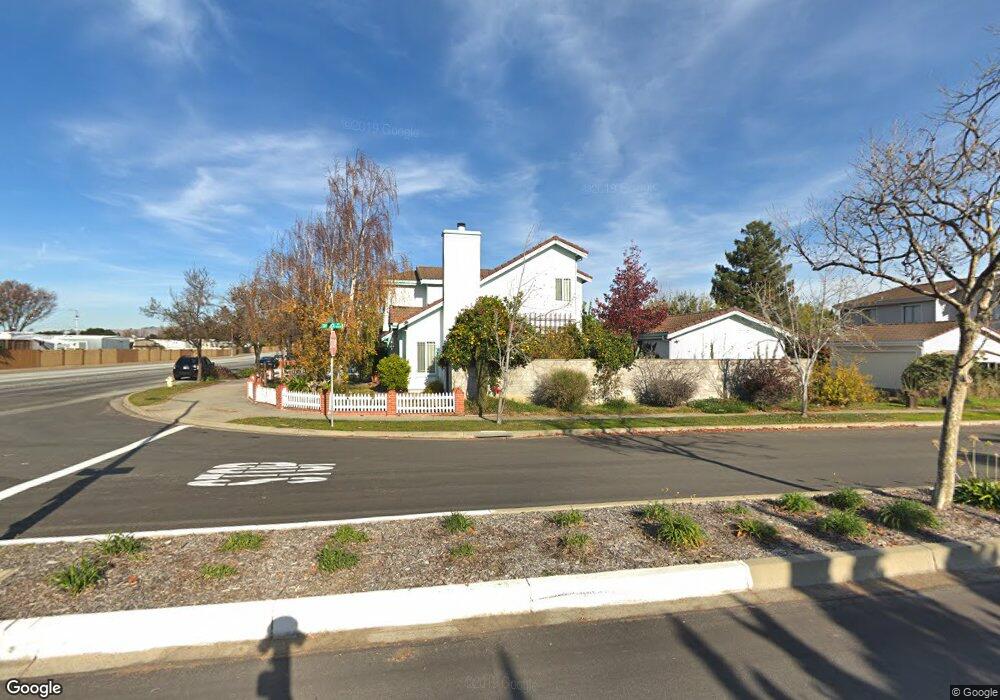
4126 Deep Creek Rd Fremont, CA 94555
Ardenwood NeighborhoodEstimated Value: $1,362,000 - $1,926,000
4
Beds
3
Baths
1,750
Sq Ft
$982/Sq Ft
Est. Value
About This Home
This home is located at 4126 Deep Creek Rd, Fremont, CA 94555 and is currently estimated at $1,719,297, approximately $982 per square foot. 4126 Deep Creek Rd is a home located in Alameda County with nearby schools including Ardenwood Elementary, Thornton Middle School, and American High School.
Ownership History
Date
Name
Owned For
Owner Type
Purchase Details
Closed on
Nov 8, 2004
Sold by
Dhanani Ali
Bought by
Prabhu Vinod K and Prabhu Sujatha
Current Estimated Value
Home Financials for this Owner
Home Financials are based on the most recent Mortgage that was taken out on this home.
Original Mortgage
$510,400
Outstanding Balance
$230,498
Interest Rate
4.37%
Mortgage Type
Purchase Money Mortgage
Estimated Equity
$1,488,799
Purchase Details
Closed on
Sep 9, 2004
Sold by
Patel Rama
Bought by
Dhanani Ali
Home Financials for this Owner
Home Financials are based on the most recent Mortgage that was taken out on this home.
Original Mortgage
$510,400
Outstanding Balance
$230,498
Interest Rate
4.37%
Mortgage Type
Purchase Money Mortgage
Estimated Equity
$1,488,799
Purchase Details
Closed on
Oct 21, 1994
Sold by
Rivers David A and Rivers Marlene E
Bought by
Torres Luis J and Torres Reynalda
Home Financials for this Owner
Home Financials are based on the most recent Mortgage that was taken out on this home.
Original Mortgage
$213,750
Interest Rate
7.2%
Create a Home Valuation Report for This Property
The Home Valuation Report is an in-depth analysis detailing your home's value as well as a comparison with similar homes in the area
Home Values in the Area
Average Home Value in this Area
Purchase History
| Date | Buyer | Sale Price | Title Company |
|---|---|---|---|
| Prabhu Vinod K | $646,000 | Fidelity National Title Co | |
| Dhanani Ali | -- | -- | |
| Dhanani Ali | $575,000 | -- | |
| Torres Luis J | $225,000 | American Title Insurance Co |
Source: Public Records
Mortgage History
| Date | Status | Borrower | Loan Amount |
|---|---|---|---|
| Open | Prabhu Vinod K | $510,400 | |
| Previous Owner | Dhanani Ali | $460,000 | |
| Previous Owner | Torres Luis J | $213,750 | |
| Closed | Dhanani Ali | $115,000 |
Source: Public Records
Tax History Compared to Growth
Tax History
| Year | Tax Paid | Tax Assessment Tax Assessment Total Assessment is a certain percentage of the fair market value that is determined by local assessors to be the total taxable value of land and additions on the property. | Land | Improvement |
|---|---|---|---|---|
| 2025 | $10,741 | $893,381 | $270,114 | $630,267 |
| 2024 | $10,741 | $875,732 | $264,819 | $617,913 |
| 2023 | $10,454 | $865,426 | $259,628 | $605,798 |
| 2022 | $10,320 | $841,462 | $254,538 | $593,924 |
| 2021 | $10,066 | $824,827 | $249,548 | $582,279 |
| 2020 | $10,100 | $823,300 | $246,990 | $576,310 |
| 2019 | $9,984 | $807,163 | $242,149 | $565,014 |
| 2018 | $9,789 | $791,343 | $237,403 | $553,940 |
| 2017 | $9,543 | $775,832 | $232,749 | $543,083 |
| 2016 | $9,381 | $760,625 | $228,187 | $532,438 |
| 2015 | $9,258 | $749,204 | $224,761 | $524,443 |
| 2014 | $9,099 | $734,534 | $220,360 | $514,174 |
Source: Public Records
Map
Nearby Homes
- 4141 Deep Creek Rd Unit 137
- 4243 Nerissa Cir
- 4516 Roderigo Ct
- 4480 Norocco Cir
- 33283 Sunriver Common
- 3691 Thrush Terrace
- 4512 Macbeth Ave
- 3851 Milton Terrace
- 33228 Jamie Cir
- 33162 Lake Pyramid St
- 4272 Warbler Loop
- 3840 Springfield Common
- 3355 Winter Wren Place
- 328 Waikiki Cir
- 33010 Lake Mead Dr
- 34102 Zaner Way
- 3501 Lake Ontario Dr
- 192 Hawaii Cir
- 34552 Nantucket Common
- 34512 Nantucket Common
- 4116 Deep Creek Rd
- 4195 Horatio Way
- 4106 Deep Creek Rd
- 4175 Horatio Way
- 4155 Horatio Way
- 4214 Deep Creek Rd
- 4096 Deep Creek Rd
- 33707 Shylock Dr
- 4135 Horatio Way
- 4086 Deep Creek Rd
- 4222 Deep Creek Rd
- 33713 Shylock Dr
- 4076 Deep Creek Rd
- 33710 Shylock Dr
- 4172 Polonius Cir
- 4115 Horatio Way
- 4234 Deep Creek Rd
- 33727 Shylock Dr
- 4066 Deep Creek Rd
- 4162 Polonius Cir