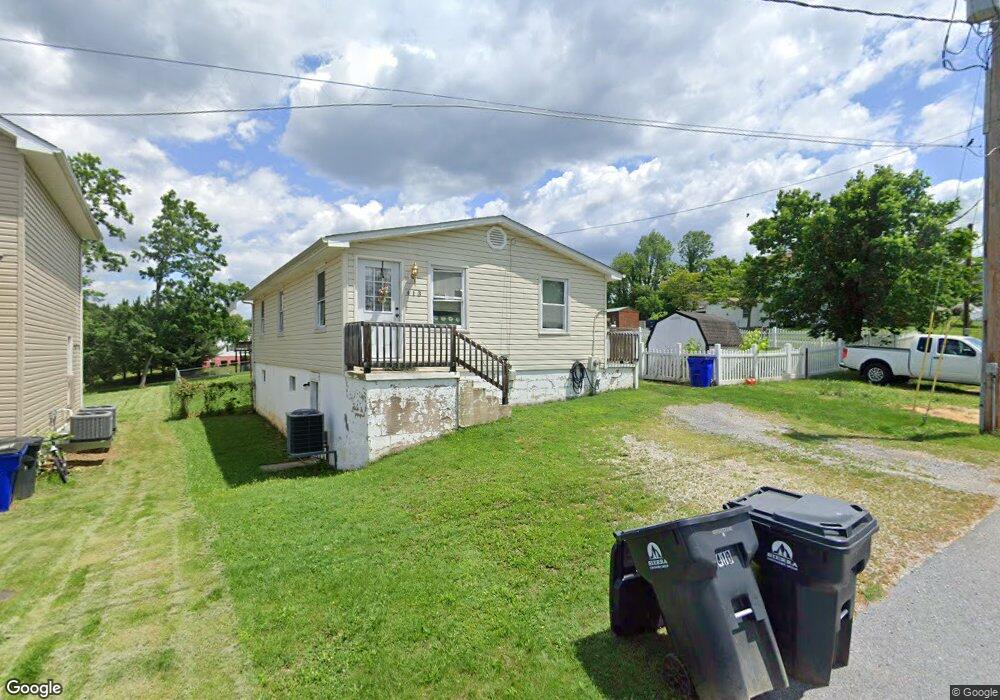
413 E E St Brunswick, MD 21716
Estimated Value: $297,791 - $355,000
Studio
2
Baths
1,056
Sq Ft
$299/Sq Ft
Est. Value
About This Home
This home is located at 413 E E St, Brunswick, MD 21716 and is currently estimated at $315,448, approximately $298 per square foot. 413 E E St is a home located in Frederick County with nearby schools including Brunswick Elementary School, Brunswick Middle School, and Brunswick High School.
Ownership History
Date
Name
Owned For
Owner Type
Purchase Details
Closed on
May 23, 2002
Sold by
Riley Lunny R
Bought by
Vaughan Samuel
Current Estimated Value
Purchase Details
Closed on
Sep 13, 1999
Sold by
Brown Hubert R and Brown Lisa J
Bought by
Riley Lunny R
Purchase Details
Closed on
Jun 24, 1999
Sold by
Citizens Mortgage Corporation
Bought by
Brown Hubert R and Brown Lisa J
Purchase Details
Closed on
Feb 24, 1999
Sold by
Everly Joan
Bought by
Citizens Mortgage Corporation
Create a Home Valuation Report for This Property
The Home Valuation Report is an in-depth analysis detailing your home's value as well as a comparison with similar homes in the area
Home Values in the Area
Average Home Value in this Area
Purchase History
| Date | Buyer | Sale Price | Title Company |
|---|---|---|---|
| Vaughan Samuel | $100,000 | -- | |
| Riley Lunny R | $95,000 | -- | |
| Brown Hubert R | $67,000 | -- | |
| Citizens Mortgage Corporation | $72,000 | -- |
Source: Public Records
Mortgage History
| Date | Status | Borrower | Loan Amount |
|---|---|---|---|
| Closed | Brown Hubert R | -- |
Source: Public Records
Tax History
| Year | Tax Paid | Tax Assessment Tax Assessment Total Assessment is a certain percentage of the fair market value that is determined by local assessors to be the total taxable value of land and additions on the property. | Land | Improvement |
|---|---|---|---|---|
| 2025 | $3,247 | $206,867 | -- | -- |
| 2024 | $3,247 | $195,900 | $85,200 | $110,700 |
| 2023 | $2,906 | $180,300 | $0 | $0 |
| 2022 | $2,663 | $164,700 | $0 | $0 |
| 2021 | $2,249 | $149,100 | $60,000 | $89,100 |
| 2020 | $2,249 | $138,233 | $0 | $0 |
| 2019 | $2,079 | $127,367 | $0 | $0 |
| 2018 | $1,943 | $116,500 | $43,100 | $73,400 |
| 2017 | $1,898 | $116,500 | $0 | $0 |
| 2016 | $2,106 | $112,167 | $0 | $0 |
| 2015 | $2,106 | $110,000 | $0 | $0 |
| 2014 | $2,106 | $110,000 | $0 | $0 |
Source: Public Records
Map
Nearby Homes
- 37 E C St
- 23 E F St
- 805 E B St
- 0 E D St Unit MDFR2057714
- 9 9th Ave
- 519 N Maple Ave
- 7 W B St
- 8 S Maple Ave
- 11 W I St
- 926 E A St
- 15 N Maryland Ave
- 213 Wintergreen Ln
- 8 N Virginia Ave
- 21 W Orndorff Dr
- TBB Shenandoah View Pkwy Unit ORCHID
- TBB Shenandoah View Pkwy Unit DAHLIA
- Homesite 232 Potomac View Pkwy
- 7 Afton Ct
- 1602C New York Ave
- 1211 Long Farm Ln
Your Personal Tour Guide
Ask me questions while you tour the home.