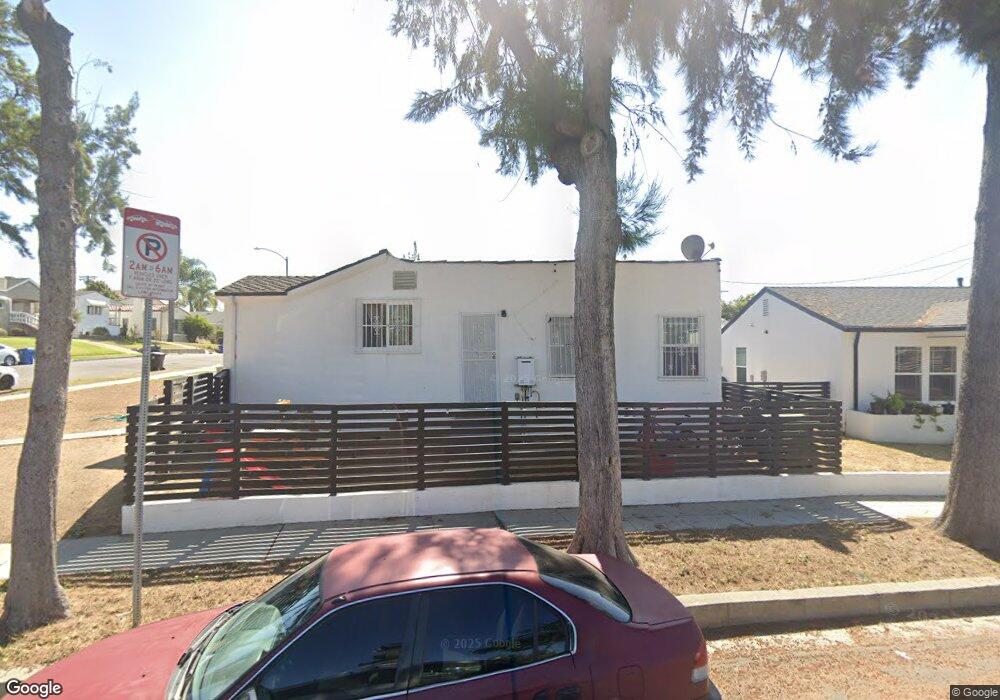
4130 W 58th Place Los Angeles, CA 90043
Hyde Park NeighborhoodEstimated Value: $976,000 - $1,592,000
5
Beds
3
Baths
2,192
Sq Ft
$554/Sq Ft
Est. Value
About This Home
This home is located at 4130 W 58th Place, Los Angeles, CA 90043 and is currently estimated at $1,214,000, approximately $553 per square foot. 4130 W 58th Place is a home located in Los Angeles County with nearby schools including Fifty-Fourth Street Elementary School, Audubon Middle School, and Crenshaw Science, Technology, Engineering, Math And Medicine Magnet.
Ownership History
Date
Name
Owned For
Owner Type
Purchase Details
Closed on
Dec 14, 2023
Sold by
Davis Kirkland Edward
Bought by
Kirkland E Davis Living Trust and Davis
Current Estimated Value
Purchase Details
Closed on
Sep 24, 1999
Sold by
Hud
Bought by
Davis Kirkland Edward
Home Financials for this Owner
Home Financials are based on the most recent Mortgage that was taken out on this home.
Original Mortgage
$89,775
Interest Rate
7.76%
Mortgage Type
FHA
Purchase Details
Closed on
Apr 9, 1999
Sold by
Norwest Mtg Inc
Bought by
Hud
Purchase Details
Closed on
Mar 9, 1999
Sold by
Hutchinson Joyce
Bought by
Norwest Mtg Inc
Purchase Details
Closed on
Nov 4, 1996
Sold by
Stelly Betty
Bought by
Hutchinson Joyce
Home Financials for this Owner
Home Financials are based on the most recent Mortgage that was taken out on this home.
Original Mortgage
$146,409
Interest Rate
7.74%
Mortgage Type
FHA
Create a Home Valuation Report for This Property
The Home Valuation Report is an in-depth analysis detailing your home's value as well as a comparison with similar homes in the area
Home Values in the Area
Average Home Value in this Area
Purchase History
| Date | Buyer | Sale Price | Title Company |
|---|---|---|---|
| Kirkland E Davis Living Trust | -- | None Listed On Document | |
| Davis Kirkland Edward | $176,000 | Provident Title Company | |
| Hud | -- | First American Title Ins Co | |
| Norwest Mtg Inc | $157,737 | Fidelity National Title Ins | |
| Hutchinson Joyce | $149,000 | California Counties Title Co |
Source: Public Records
Mortgage History
| Date | Status | Borrower | Loan Amount |
|---|---|---|---|
| Previous Owner | Davis Kirkland Edward | $89,775 | |
| Previous Owner | Hutchinson Joyce | $146,409 |
Source: Public Records
Tax History Compared to Growth
Tax History
| Year | Tax Paid | Tax Assessment Tax Assessment Total Assessment is a certain percentage of the fair market value that is determined by local assessors to be the total taxable value of land and additions on the property. | Land | Improvement |
|---|---|---|---|---|
| 2025 | $6,288 | $486,081 | $212,094 | $273,987 |
| 2024 | $6,288 | $476,551 | $207,936 | $268,615 |
| 2023 | $6,174 | $467,208 | $203,859 | $263,349 |
| 2022 | $5,902 | $458,048 | $199,862 | $258,186 |
| 2021 | $3,467 | $255,569 | $195,944 | $59,625 |
| 2019 | $3,369 | $247,990 | $190,133 | $57,857 |
| 2018 | $3,285 | $243,128 | $186,405 | $56,723 |
| 2016 | $3,137 | $233,688 | $179,167 | $54,521 |
| 2015 | $3,091 | $230,179 | $176,476 | $53,703 |
| 2014 | $3,106 | $225,672 | $173,020 | $52,652 |
Source: Public Records
Map
Nearby Homes
- 4137 W 58th Place
- 4243 W 58th Place
- 4254 W 58th Place
- 4263 W 59th St
- 5659 Valley Glen Way
- 4313 W 59th St
- 4325 W 58th Place
- 4329 W 58th Place
- 4408 W 59th St
- 4210 W 62nd St
- 3854 W 59th St
- 4440 W 58th Place
- 5714 Keniston Ave
- 3831 W 60th St
- 5329 Marburn Ave
- 5452 Harcross Dr
- 5909 Overhill Dr
- 6018 S Harcourt Ave
- 6006 Overhill Dr
- 3961 W 64th St
- 4128 W 58th Place
- 4126 W 58th Place
- 4200 W 58th Place
- 4200 W 58th Place
- 4122 W 58th Place
- 4202 W 58th Place
- 4125 W 59th St
- 4121 W 59th St
- 4117 W 59th St
- 4116 W 58th Place
- 4201 W 59th St
- 4206 W 58th Place
- 4133 W 58th Place
- 4113 W 59th St
- 4129 W 58th Place
- 4205 W 59th St
- 4125 W 58th Place
- 4112 W 58th Place
- 4141 W 58th Place
- 4210 W 58th Place