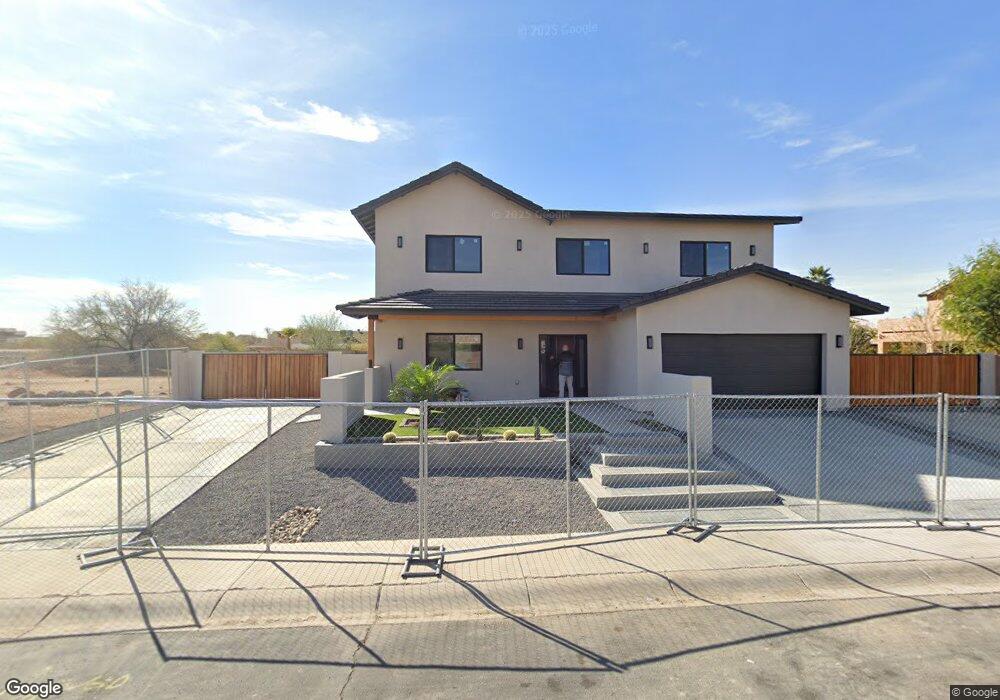
4133 W Marco Polo Rd Unit 13 Glen Dale, AZ 85308
Deer Valley NeighborhoodEstimated Value: $1,032,000 - $1,248,054
--
Bed
--
Bath
--
Sq Ft
0.25
Acres
About This Home
This home is located at 4133 W Marco Polo Rd Unit 13, Glen Dale, AZ 85308 and is currently estimated at $1,182,514. 4133 W Marco Polo Rd Unit 13 is a home located in Maricopa County with nearby schools including Park Meadows Elementary School, Barry Goldwater High School, and Deer Valley Middle School.
Ownership History
Date
Name
Owned For
Owner Type
Purchase Details
Closed on
Jul 17, 2023
Sold by
Fletcher Tyson M and Fletcher Nikole
Bought by
Maq Capital Group Llc
Current Estimated Value
Home Financials for this Owner
Home Financials are based on the most recent Mortgage that was taken out on this home.
Original Mortgage
$290,000
Outstanding Balance
$283,082
Interest Rate
6.79%
Mortgage Type
New Conventional
Estimated Equity
$899,432
Purchase Details
Closed on
Apr 21, 2017
Sold by
Jurgensen Phillip and Jurgensen Philip
Bought by
Fletcher Tyson M and Fletcher Nikole
Home Financials for this Owner
Home Financials are based on the most recent Mortgage that was taken out on this home.
Original Mortgage
$58,800
Interest Rate
4.23%
Mortgage Type
Future Advance Clause Open End Mortgage
Purchase Details
Closed on
Nov 15, 2007
Sold by
Cass Todd and Gilbert Christopher
Bought by
Jurgensen Philip
Create a Home Valuation Report for This Property
The Home Valuation Report is an in-depth analysis detailing your home's value as well as a comparison with similar homes in the area
Home Values in the Area
Average Home Value in this Area
Purchase History
| Date | Buyer | Sale Price | Title Company |
|---|---|---|---|
| Maq Capital Group Llc | $300,000 | Driggs Title Agency | |
| Fletcher Tyson M | $90,000 | Stewart Title Arizona Agency | |
| Jurgensen Philip | $240,000 | Magnus Title Agency |
Source: Public Records
Mortgage History
| Date | Status | Borrower | Loan Amount |
|---|---|---|---|
| Open | Maq Capital Group Llc | $290,000 | |
| Previous Owner | Fletcher Tyson M | $58,800 |
Source: Public Records
Tax History Compared to Growth
Tax History
| Year | Tax Paid | Tax Assessment Tax Assessment Total Assessment is a certain percentage of the fair market value that is determined by local assessors to be the total taxable value of land and additions on the property. | Land | Improvement |
|---|---|---|---|---|
| 2025 | $531 | $5,247 | $5,247 | -- |
| 2024 | $523 | $4,997 | $4,997 | -- |
| 2023 | $523 | $9,870 | $9,870 | $0 |
| 2022 | $505 | $10,620 | $10,620 | $0 |
| 2021 | $519 | $10,965 | $10,965 | $0 |
| 2020 | $510 | $11,580 | $11,580 | $0 |
| 2019 | $495 | $8,565 | $8,565 | $0 |
| 2018 | $479 | $8,415 | $8,415 | $0 |
| 2017 | $464 | $5,625 | $5,625 | $0 |
| 2016 | $440 | $4,500 | $4,500 | $0 |
| 2015 | $421 | $5,744 | $5,744 | $0 |
Source: Public Records
Map
Nearby Homes
- 4209 W Marco Polo Rd
- 4019 W Escuda Dr
- 20003 N 43rd Dr
- 4327 W Tonto Rd
- 4414 W Oraibi Dr
- 3911 W Oraibi Dr Unit 6
- 20405 N 42nd Ave
- 19810 N 38th Ave
- 4230 W Yorkshire Dr Unit D
- 20038 N 38th Ln
- 20021 N 38th Ln
- 20435 N 39th Dr
- 20644 N 41st Ave
- 3714 W Behrend Dr
- 4405 W Taro Dr
- 3651 W Escuda Dr
- 3651 W Oraibi Dr Unit 29
- 4613 W Wahalla Ln
- 3629 W Behrend Dr
- 19809 N 47th Ave
- 4133 W Marco Polo Rd Unit 2
- 4133 W Marco Polo Rd
- 4133 W Marco Polo Rd
- 4129 W Marco Polo Rd
- 19811 N 42nd Ave
- 19807 N 42nd Ave
- 19904 N 41st Ln
- 4138 W Behrend Dr
- 19803 N 42nd Ave
- 4134 W Marco Polo Rd
- 19908 N 41st Ln
- 19907 N 41st Ln
- 4138 W Marco Polo Rd
- 4202 W Marco Polo Rd
- 19812 N 42nd Ave
- 19912 N 41st Ln
- 19911 N 41st Ln
- 19808 N 42nd Ave
- 4206 W Marco Polo Rd
- 4135 W Wahalla Ln