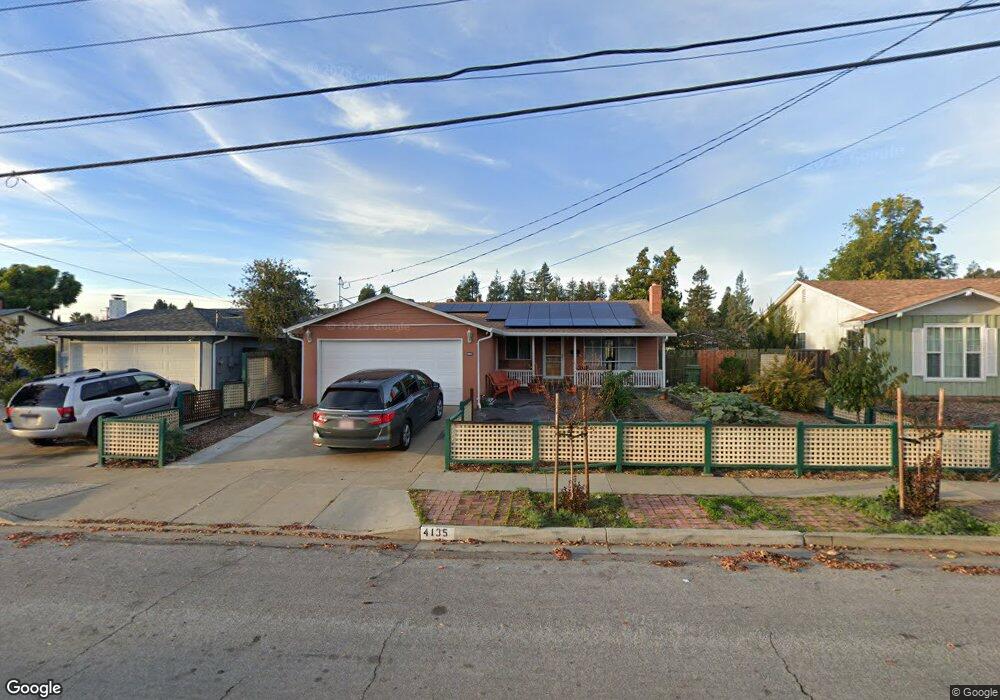
4135 Margery Dr Fremont, CA 94538
Sundale NeighborhoodEstimated Value: $1,217,801 - $1,390,000
3
Beds
2
Baths
1,107
Sq Ft
$1,204/Sq Ft
Est. Value
About This Home
This home is located at 4135 Margery Dr, Fremont, CA 94538 and is currently estimated at $1,332,700, approximately $1,203 per square foot. 4135 Margery Dr is a home located in Alameda County with nearby schools including John Blacow Elementary School, G.M. Walters Middle School, and John F. Kennedy High School.
Ownership History
Date
Name
Owned For
Owner Type
Purchase Details
Closed on
Mar 28, 2019
Sold by
Craig Benjamin and Craig Jessica
Bought by
Craig Jessica and Craig Benjamin
Current Estimated Value
Purchase Details
Closed on
Dec 11, 2013
Sold by
Shokun Aleksei and Shokun Natalia
Bought by
Craig Benjamin and Craig Jessica
Home Financials for this Owner
Home Financials are based on the most recent Mortgage that was taken out on this home.
Original Mortgage
$417,000
Outstanding Balance
$309,577
Interest Rate
4.04%
Mortgage Type
New Conventional
Estimated Equity
$1,023,123
Purchase Details
Closed on
Aug 8, 2000
Sold by
Park Joyce Marie
Bought by
Shokun Aleksei and Shokun Natalia
Home Financials for this Owner
Home Financials are based on the most recent Mortgage that was taken out on this home.
Original Mortgage
$262,000
Interest Rate
8.16%
Purchase Details
Closed on
May 12, 1999
Sold by
Park Joyce Marie
Bought by
Park Joyce Marie and The 1999 Park Family Trust
Create a Home Valuation Report for This Property
The Home Valuation Report is an in-depth analysis detailing your home's value as well as a comparison with similar homes in the area
Home Values in the Area
Average Home Value in this Area
Purchase History
| Date | Buyer | Sale Price | Title Company |
|---|---|---|---|
| Craig Jessica | -- | None Available | |
| Craig Family Revocable Trust | -- | None Available | |
| Craig Benjamin | $530,000 | Old Republic Title Company | |
| Shokun Aleksei | $332,000 | American Title Co | |
| Park Joyce Marie | -- | -- |
Source: Public Records
Mortgage History
| Date | Status | Borrower | Loan Amount |
|---|---|---|---|
| Open | Craig Benjamin | $417,000 | |
| Previous Owner | Shokun Aleksei | $262,000 | |
| Closed | Shokun Aleksei | $53,400 |
Source: Public Records
Tax History Compared to Growth
Tax History
| Year | Tax Paid | Tax Assessment Tax Assessment Total Assessment is a certain percentage of the fair market value that is determined by local assessors to be the total taxable value of land and additions on the property. | Land | Improvement |
|---|---|---|---|---|
| 2025 | $8,060 | $651,968 | $194,903 | $464,065 |
| 2024 | $8,060 | $639,051 | $191,083 | $454,968 |
| 2023 | $7,838 | $633,384 | $187,336 | $446,048 |
| 2022 | $7,729 | $613,967 | $183,664 | $437,303 |
| 2021 | $7,541 | $601,796 | $180,064 | $428,732 |
| 2020 | $7,503 | $599,555 | $178,218 | $421,337 |
| 2019 | $7,418 | $587,803 | $174,725 | $413,078 |
| 2018 | $7,271 | $576,281 | $171,300 | $404,981 |
| 2017 | $7,089 | $564,984 | $167,942 | $397,042 |
| 2016 | $6,964 | $553,906 | $164,649 | $389,257 |
| 2015 | $6,867 | $545,588 | $162,176 | $383,412 |
| 2014 | $6,688 | $530,000 | $159,000 | $371,000 |
Source: Public Records
Map
Nearby Homes
- 39993 Fremont Blvd Unit 102
- 4453 Porter St
- 4421 Cahill St
- 3909 Stevenson Blvd Unit 402
- 40702 Greystone Terrace Unit 9
- 40116 Crockett St
- 3695 Stevenson Blvd Unit E206
- 4555 Stevenson Blvd
- 4214 Providence Terrace
- 4310 Providence Terrace
- 40708 Fremont Blvd
- 40469 Shaw Ct
- 4463 Hyde Common Unit 306
- 3583 Madison Common
- 3518 Madison Common
- 40769 Squill Common
- 4600 Nelson St
- 3454 Dayton Common
- 4737 Boone Dr
- 40425 Chapel Way Unit 214
- 4127 Margery Dr
- 4143 Margery Dr
- 4119 Margery Dr
- 4151 Margery Dr
- 4136 Margery Dr
- 4128 Margery Dr
- 4144 Margery Dr
- 4111 Margery Dr
- 4205 Margery Dr
- 40167 Blanchard St
- 40159 Blanchard St
- 4120 Margery Dr
- 40175 Blanchard St
- 40151 Blanchard St
- 40183 Blanchard St
- 4112 Margery Dr
- 4073 Margery Dr
- 4213 Margery Dr
- 40143 Blanchard St
- 40258 Pacific St