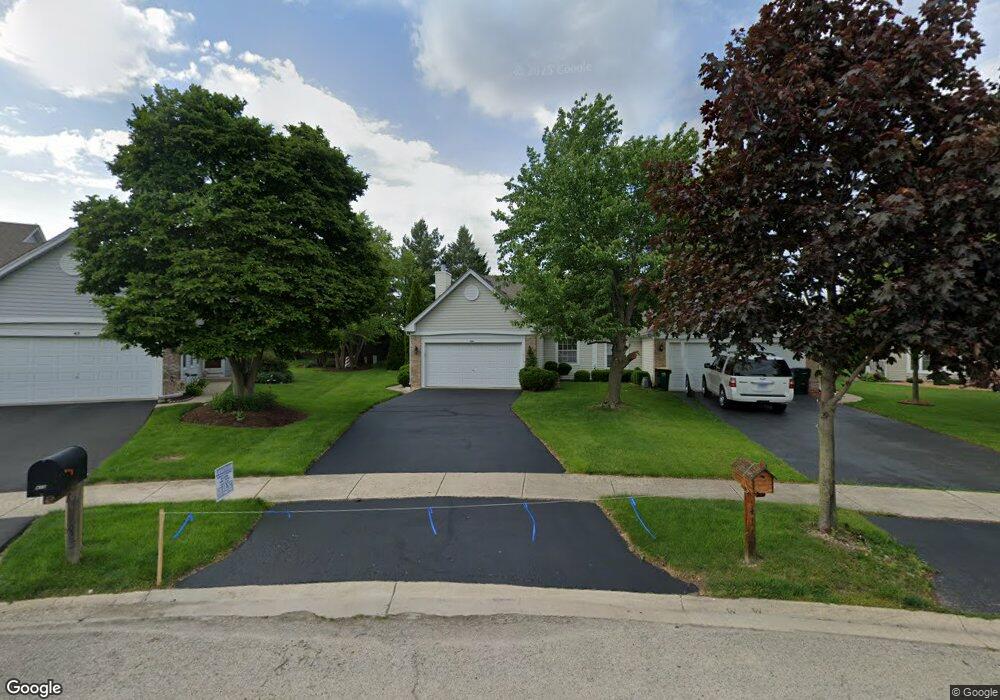
414 Carriage Ct Unit 1 Oswego, IL 60543
South Oswego NeighborhoodEstimated Value: $298,000 - $321,324
3
Beds
2
Baths
1,346
Sq Ft
$229/Sq Ft
Est. Value
About This Home
This home is located at 414 Carriage Ct Unit 1, Oswego, IL 60543 and is currently estimated at $308,581, approximately $229 per square foot. 414 Carriage Ct Unit 1 is a home located in Kendall County with nearby schools including Prairie Point Elementary School, Traughber Junior High School, and Oswego High School.
Ownership History
Date
Name
Owned For
Owner Type
Purchase Details
Closed on
Apr 27, 2004
Sold by
Collins Robert J and Collins Geraldine M
Bought by
Collins Robert J and Collins Geraldine M
Current Estimated Value
Purchase Details
Closed on
Nov 13, 2002
Sold by
Wilde Gregory P and Wilde Tina M
Bought by
Collins Robert J and Collins Geraldine M
Home Financials for this Owner
Home Financials are based on the most recent Mortgage that was taken out on this home.
Original Mortgage
$77,000
Interest Rate
5.37%
Mortgage Type
Purchase Money Mortgage
Purchase Details
Closed on
Dec 15, 1997
Sold by
The Old Second National Bank Of Aurora
Bought by
Wilde Gregory P and Wilde Tina M
Home Financials for this Owner
Home Financials are based on the most recent Mortgage that was taken out on this home.
Original Mortgage
$115,000
Interest Rate
6.7%
Mortgage Type
Balloon
Create a Home Valuation Report for This Property
The Home Valuation Report is an in-depth analysis detailing your home's value as well as a comparison with similar homes in the area
Home Values in the Area
Average Home Value in this Area
Purchase History
| Date | Buyer | Sale Price | Title Company |
|---|---|---|---|
| Collins Robert J | -- | -- | |
| Collins Robert J | $157,000 | -- | |
| Wilde Gregory P | $145,000 | Ticor Title Insurance |
Source: Public Records
Mortgage History
| Date | Status | Borrower | Loan Amount |
|---|---|---|---|
| Previous Owner | Collins Robert J | $77,000 | |
| Previous Owner | Wilde Gregory P | $115,000 |
Source: Public Records
Tax History Compared to Growth
Tax History
| Year | Tax Paid | Tax Assessment Tax Assessment Total Assessment is a certain percentage of the fair market value that is determined by local assessors to be the total taxable value of land and additions on the property. | Land | Improvement |
|---|---|---|---|---|
| 2024 | $6,045 | $86,120 | $12,085 | $74,035 |
| 2023 | $0 | $74,887 | $10,509 | $64,378 |
| 2022 | $5,662 | $68,703 | $9,641 | $59,062 |
| 2021 | $5,620 | $66,060 | $9,270 | $56,790 |
| 2020 | $5,493 | $64,136 | $9,000 | $55,136 |
| 2019 | $5,634 | $64,693 | $9,000 | $55,693 |
| 2018 | $4,861 | $56,252 | $10,909 | $45,343 |
| 2017 | $4,700 | $51,845 | $10,054 | $41,791 |
| 2016 | $4,487 | $49,142 | $9,530 | $39,612 |
| 2015 | $5,057 | $46,361 | $8,991 | $37,370 |
| 2014 | -- | $45,011 | $8,729 | $36,282 |
| 2013 | -- | $45,465 | $8,817 | $36,648 |
Source: Public Records
Map
Nearby Homes
- 371 S Madison St
- 616 Briarwood Ln
- 395 Danforth Dr
- 206 E Washington St
- 714 Pinehurst Ln
- 114 Riverview Ct
- 613 Murdock Place
- 388 Danforth Dr
- 423 Hathaway Ln
- 610 Murdock Place
- 611 Murdock Place
- 421 Hathaway Ln
- 5161 US Highway 34
- 5055 U S 34
- 315 White Pines Ln
- 177 Franklin St
- 55 Garfield St
- 34 N Adams St
- 101 Bell Ct
- 170 Chicago Rd
- 412 Carriage Ct Unit 1
- 413 Carriage Ct Unit 1
- 410 Carriage Ct
- 415 Carriage Ct Unit 1
- 415 Carriage Ct
- 411 Carriage Ct Unit 1
- 408 Carriage Ct Unit 1
- 406 Carriage Ct Unit 1
- 409 Carriage Ct Unit 1
- 4781 Illinois 71 Unit 3
- 519 Northgate Cir Unit 1
- 521 Northgate Cir
- 521 Northgate Cir Unit 2
- 517 Northgate Cir
- 402 Carriage Ct
- 407 Carriage Ct
- 515 Northgate Cir
- 523 Northgate Cir
- 203 Dorchester Ct
- 403 Carriage Ct