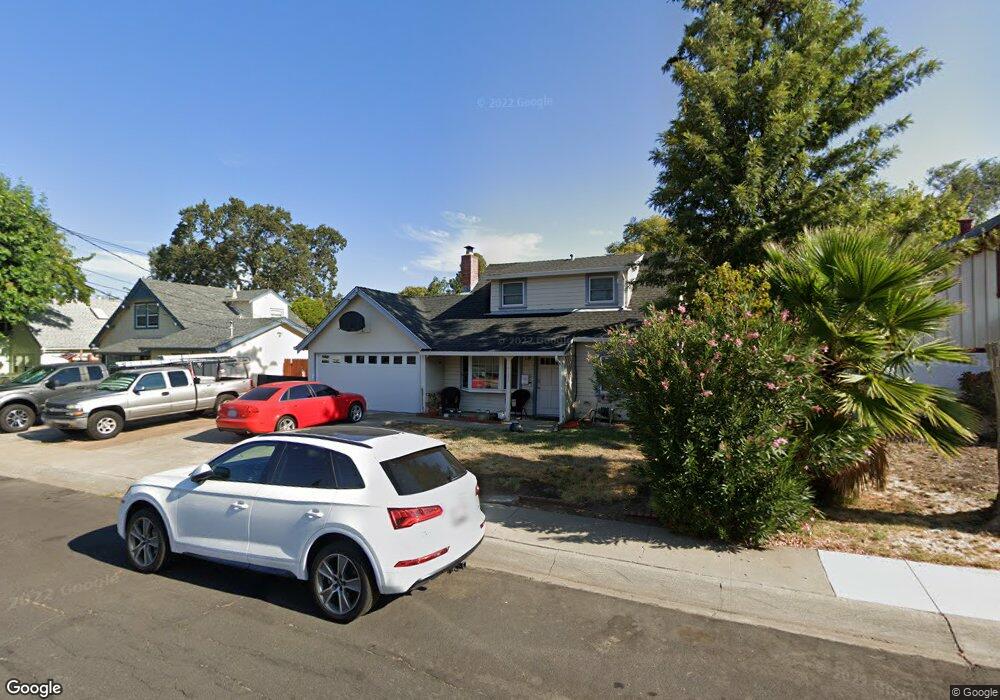
4143 Pickwick Dr Concord, CA 94521
Cowell/Canterbury NeighborhoodEstimated Value: $727,000 - $796,000
4
Beds
2
Baths
1,216
Sq Ft
$619/Sq Ft
Est. Value
About This Home
This home is located at 4143 Pickwick Dr, Concord, CA 94521 and is currently estimated at $752,299, approximately $618 per square foot. 4143 Pickwick Dr is a home located in Contra Costa County with nearby schools including El Monte Elementary School, El Dorado Middle School, and Concord High School.
Ownership History
Date
Name
Owned For
Owner Type
Purchase Details
Closed on
May 21, 2025
Sold by
Castaneda Gail and Castaneda Kim
Bought by
Castaneda Gail M and Castaneda Kim
Current Estimated Value
Purchase Details
Closed on
May 24, 2004
Sold by
Currie Bradley S and Currie Karin S
Bought by
Castaneda Gail and Castaneda Kim
Home Financials for this Owner
Home Financials are based on the most recent Mortgage that was taken out on this home.
Original Mortgage
$325,815
Interest Rate
4.87%
Mortgage Type
Purchase Money Mortgage
Purchase Details
Closed on
May 18, 1999
Sold by
Hoffman Brenda L
Bought by
Currie Bradley S and Currie Karin S
Home Financials for this Owner
Home Financials are based on the most recent Mortgage that was taken out on this home.
Original Mortgage
$189,700
Interest Rate
6.86%
Mortgage Type
FHA
Purchase Details
Closed on
Aug 7, 1997
Sold by
Gin Dennis A and Gin Susanj
Bought by
Hoffman Brenda L
Home Financials for this Owner
Home Financials are based on the most recent Mortgage that was taken out on this home.
Original Mortgage
$151,330
Interest Rate
7.61%
Mortgage Type
Purchase Money Mortgage
Create a Home Valuation Report for This Property
The Home Valuation Report is an in-depth analysis detailing your home's value as well as a comparison with similar homes in the area
Home Values in the Area
Average Home Value in this Area
Purchase History
| Date | Buyer | Sale Price | Title Company |
|---|---|---|---|
| Castaneda Gail M | -- | None Listed On Document | |
| Castaneda Gail | $435,000 | Fidelity National Title | |
| Currie Bradley S | $191,000 | Chicago Title Co | |
| Hoffman Brenda L | $153,500 | Placer Title Company |
Source: Public Records
Mortgage History
| Date | Status | Borrower | Loan Amount |
|---|---|---|---|
| Previous Owner | Castaneda Gail | $325,815 | |
| Previous Owner | Currie Bradley S | $189,700 | |
| Previous Owner | Hoffman Brenda L | $151,330 | |
| Closed | Castaneda Gail | $65,250 |
Source: Public Records
Tax History
| Year | Tax Paid | Tax Assessment Tax Assessment Total Assessment is a certain percentage of the fair market value that is determined by local assessors to be the total taxable value of land and additions on the property. | Land | Improvement |
|---|---|---|---|---|
| 2025 | $7,760 | $618,460 | $383,874 | $234,586 |
| 2024 | $7,560 | $606,335 | $376,348 | $229,987 |
| 2023 | $7,416 | $594,447 | $368,969 | $225,478 |
| 2022 | $7,315 | $582,792 | $361,735 | $221,057 |
| 2021 | $7,134 | $571,366 | $354,643 | $216,723 |
| 2019 | $6,663 | $525,000 | $325,864 | $199,136 |
| 2018 | $6,317 | $506,500 | $314,381 | $192,119 |
| 2017 | $5,961 | $483,500 | $300,105 | $183,395 |
| 2016 | $5,309 | $430,000 | $266,898 | $163,102 |
| 2015 | $5,125 | $413,000 | $256,346 | $156,654 |
| 2014 | $3,763 | $292,500 | $181,552 | $110,948 |
Source: Public Records
Map
Nearby Homes
- 4185 Huckleberry Dr
- 4225 Sherwood Ct
- 4020 Joan Ave
- 4081 Clayton Rd Unit 235
- 1430 Bel Air Dr Unit 305
- 1430 Bel Air Dr Unit 103
- 1450 Bel Air Dr Unit 110
- 4024 Salem St
- 1579 West St
- 1536 Lavetta Way
- 4273 Armand Dr
- 4063 Salem St
- 3901 Clayton Rd Unit 25
- 4044 Cowell Rd
- 1515 Thornwood Dr
- 1548 Dianda Dr
- 3959 Chestnut Ave
- 4151 Storey Ln
- 4632 Melody Dr Unit E
- 1579 Farm Bureau Rd
- 4139 Pickwick Dr
- 4147 Pickwick Dr
- 4142 Huckleberry Dr
- 4148 Huckleberry Dr
- 4151 Pickwick Dr
- 4136 Huckleberry Dr
- 4135 Pickwick Dr
- 4146 Pickwick Dr
- 4142 Pickwick Dr
- 4154 Huckleberry Dr
- 4132 Huckleberry Dr
- 4150 Pickwick Dr
- 4138 Pickwick Dr
- 4157 Pickwick Dr
- 4131 Pickwick Dr
- 4160 Huckleberry Dr
- 4128 Huckleberry Dr
- 4154 Pickwick Dr
- 4134 Pickwick Dr
- 4127 Pickwick Dr
Your Personal Tour Guide
Ask me questions while you tour the home.