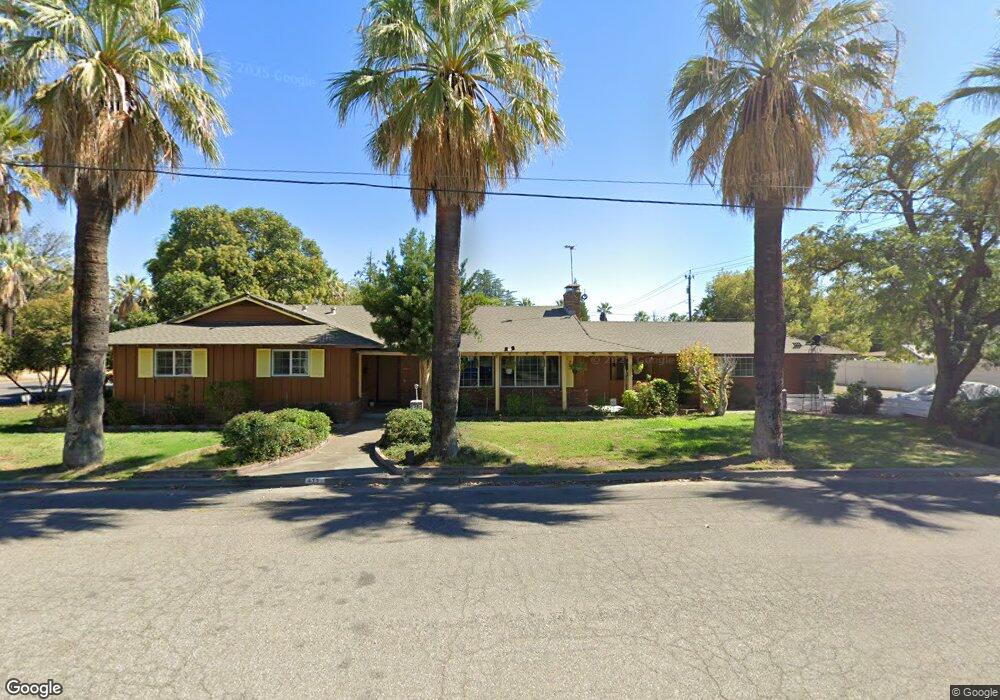
415 5th St Corning, CA 96021
Estimated Value: $321,565 - $428,000
3
Beds
3
Baths
2,090
Sq Ft
$173/Sq Ft
Est. Value
About This Home
This home is located at 415 5th St, Corning, CA 96021 and is currently estimated at $361,891, approximately $173 per square foot. 415 5th St is a home located in Tehama County with nearby schools including Woodson Elementary School, Maywood Middle School, and Corning High School.
Ownership History
Date
Name
Owned For
Owner Type
Purchase Details
Closed on
Apr 30, 2015
Sold by
Gross Glenn and Gross Glenn Allen
Bought by
Gross Glenn Allen
Current Estimated Value
Purchase Details
Closed on
Jul 8, 2009
Sold by
Slye Michael
Bought by
Gross Glenn
Purchase Details
Closed on
Mar 24, 2005
Sold by
Stevens Patricia A
Bought by
Slye Michael
Home Financials for this Owner
Home Financials are based on the most recent Mortgage that was taken out on this home.
Original Mortgage
$90,000
Interest Rate
5.6%
Mortgage Type
Unknown
Create a Home Valuation Report for This Property
The Home Valuation Report is an in-depth analysis detailing your home's value as well as a comparison with similar homes in the area
Purchase History
| Date | Buyer | Sale Price | Title Company |
|---|---|---|---|
| Gross Glenn Allen | -- | None Available | |
| Gross Glenn | $89,961 | Cr Title Services Inc | |
| Slye Michael | $230,000 | Northern California Title Co |
Source: Public Records
Mortgage History
| Date | Status | Borrower | Loan Amount |
|---|---|---|---|
| Previous Owner | Slye Michael | $90,000 |
Source: Public Records
Tax History
| Year | Tax Paid | Tax Assessment Tax Assessment Total Assessment is a certain percentage of the fair market value that is determined by local assessors to be the total taxable value of land and additions on the property. | Land | Improvement |
|---|---|---|---|---|
| 2025 | $2,147 | $215,231 | $56,143 | $159,088 |
| 2023 | $2,105 | $206,875 | $53,964 | $152,911 |
| 2022 | $2,074 | $202,819 | $52,906 | $149,913 |
| 2021 | $1,995 | $198,843 | $51,869 | $146,974 |
| 2020 | $2,015 | $196,805 | $51,338 | $145,467 |
| 2019 | $1,931 | $192,947 | $50,332 | $142,615 |
| 2018 | $1,933 | $189,165 | $49,346 | $139,819 |
| 2017 | $1,918 | $185,457 | $48,379 | $137,078 |
| 2016 | $1,787 | $181,822 | $47,431 | $134,391 |
| 2015 | -- | $179,092 | $46,719 | $132,373 |
| 2014 | -- | $175,584 | $45,804 | $129,780 |
Source: Public Records
Map
Nearby Homes
Your Personal Tour Guide
Ask me questions while you tour the home.