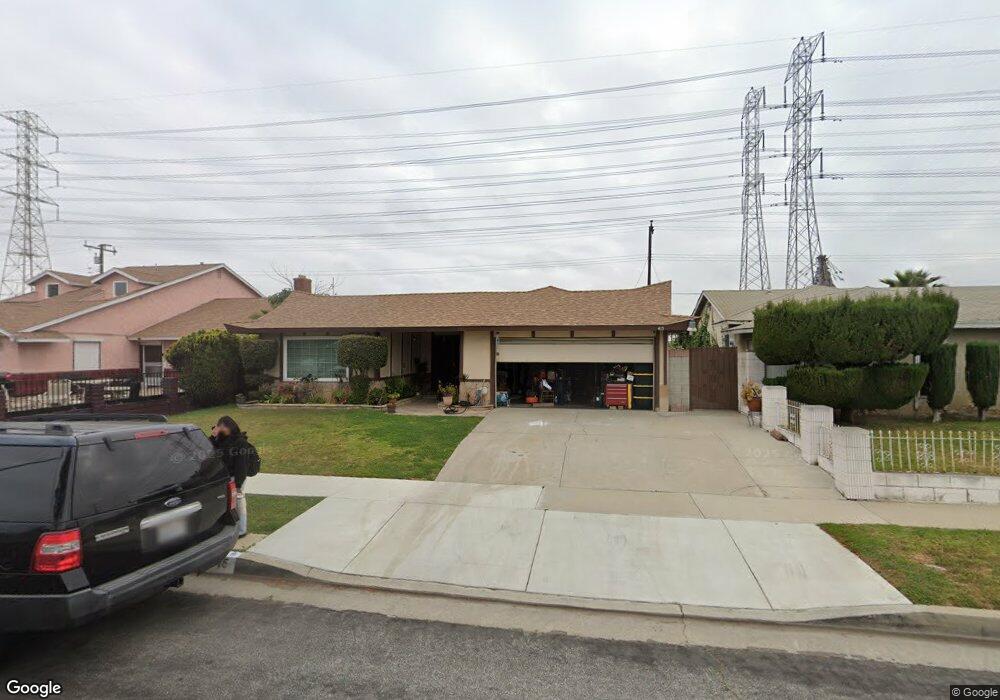
415 E 169th St Carson, CA 90746
Estimated Value: $746,505 - $882,000
4
Beds
2
Baths
1,561
Sq Ft
$514/Sq Ft
Est. Value
About This Home
This home is located at 415 E 169th St, Carson, CA 90746 and is currently estimated at $802,126, approximately $513 per square foot. 415 E 169th St is a home located in Los Angeles County with nearby schools including Ambler Avenue Elementary School, Glenn Hammond Curtiss Middle School, and Gardena Senior High School.
Ownership History
Date
Name
Owned For
Owner Type
Purchase Details
Closed on
Aug 2, 2023
Sold by
Jordan Lakeitha and Jordan Glenis Lawonda
Bought by
Jordan Lakeitha and Jordan Glenis Lawonda
Current Estimated Value
Purchase Details
Closed on
Mar 19, 2020
Sold by
Davis Josephine
Bought by
Davis Josephine and Jordan Lakeitha
Purchase Details
Closed on
Feb 3, 1997
Sold by
Davis Josephine and Jordan Lakeitha
Bought by
Davis Josephine
Purchase Details
Closed on
Nov 29, 1993
Sold by
Great Western Bank Fsb
Bought by
Davis Josephine and Jordan Lakeitha
Home Financials for this Owner
Home Financials are based on the most recent Mortgage that was taken out on this home.
Original Mortgage
$143,100
Interest Rate
7.38%
Create a Home Valuation Report for This Property
The Home Valuation Report is an in-depth analysis detailing your home's value as well as a comparison with similar homes in the area
Home Values in the Area
Average Home Value in this Area
Purchase History
| Date | Buyer | Sale Price | Title Company |
|---|---|---|---|
| Jordan Lakeitha | -- | None Listed On Document | |
| Davis Josephine | -- | Accommodation | |
| Davis Josephine | -- | -- | |
| Davis Josephine | $159,000 | Continental Land Title |
Source: Public Records
Mortgage History
| Date | Status | Borrower | Loan Amount |
|---|---|---|---|
| Previous Owner | Davis Josephine | $143,100 |
Source: Public Records
Tax History
| Year | Tax Paid | Tax Assessment Tax Assessment Total Assessment is a certain percentage of the fair market value that is determined by local assessors to be the total taxable value of land and additions on the property. | Land | Improvement |
|---|---|---|---|---|
| 2025 | $8,648 | $270,217 | $118,109 | $152,108 |
| 2024 | $8,648 | $264,920 | $115,794 | $149,126 |
| 2023 | $8,564 | $259,726 | $113,524 | $146,202 |
| 2022 | $8,376 | $254,635 | $111,299 | $143,336 |
| 2021 | $8,324 | $249,643 | $109,117 | $140,526 |
| 2019 | $8,066 | $242,241 | $105,882 | $136,359 |
| 2018 | $7,942 | $237,492 | $103,806 | $133,686 |
| 2016 | $7,781 | $228,272 | $99,776 | $128,496 |
| 2015 | $3,109 | $224,844 | $98,278 | $126,566 |
| 2014 | $3,103 | $220,440 | $96,353 | $124,087 |
Source: Public Records
Map
Nearby Homes
- 514 E Moorehaven Dr
- 16952 Roa Dr
- 17202 Ambler Ave
- 435 E Gardena Blvd
- 16928 S Broadway
- 835 E Claude St
- 17701 S Avalon Blvd Unit 81
- 17700 S Avalon Blvd Unit 156
- 17701 Avalon Blvd
- 17701 Avalon Blvd Unit 97
- 17701 Avalon Blvd Unit 400
- 15709 S Ball Ave
- 2717 W Tichenor St
- 15712 S Haskins Ave
- 523 W 170th St
- 17700 Avalon Blvd Unit 387
- 16619 S Denver Ave
- 505 E 154th St
- 15328 S San Pedro St
- 2430 W Bennett St
- 419 E 169th St
- 409 E 169th St
- 425 E 169th St
- 403 E 169th St
- 412 E 169th St
- 416 E 169th St
- 429 E 169th St
- 371 E 169th St
- 404 E 169th St
- 422 E 169th St
- 428 E 169th St
- 435 E 169th St
- 365 E 169th St
- 434 E 169th St
- 415 E Moorehaven Dr
- 409 E Moorehaven Dr
- 403 E Moorehaven Dr
- 441 E 169th St
- 419 E Moorehaven Dr
- 359 E 169th St
Your Personal Tour Guide
Ask me questions while you tour the home.