Estimated Value: $140,110 - $182,000
2
Beds
1
Bath
1,690
Sq Ft
$96/Sq Ft
Est. Value
About This Home
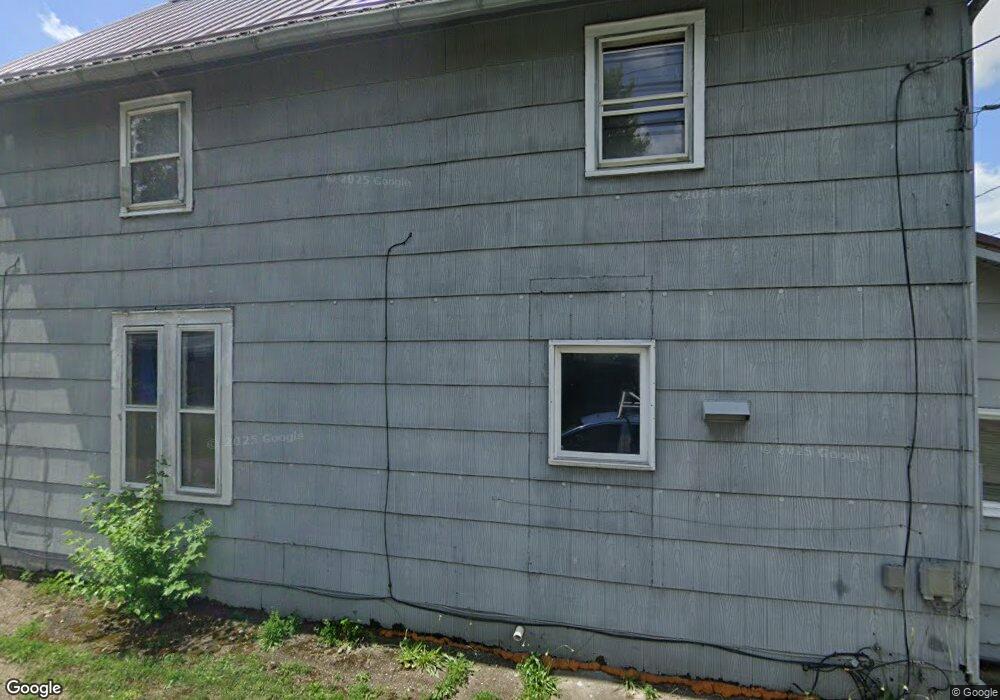
This home is located at 415 E 4th St, Dover, OH 44622 and is currently estimated at $163,028, approximately $96 per square foot. 415 E 4th St is a home located in Tuscarawas County with nearby schools including Dover High School and Tuscarawas Central Catholic Elementary School.
Ownership History
Date
Name
Owned For
Owner Type
Purchase Details
Closed on
Oct 29, 1997
Sold by
Mcinturf Jan
Bought by
Scriven Cindy A and Polen Denns E
Current Estimated Value
Home Financials for this Owner
Home Financials are based on the most recent Mortgage that was taken out on this home.
Original Mortgage
$66,258
Interest Rate
7.51%
Mortgage Type
FHA
Purchase Details
Closed on
Sep 7, 1995
Sold by
Eynon Harry E
Bought by
Mcinturf Jan and Mcinturf Roni L
Home Financials for this Owner
Home Financials are based on the most recent Mortgage that was taken out on this home.
Original Mortgage
$56,300
Interest Rate
7.76%
Mortgage Type
New Conventional
Purchase Details
Closed on
Dec 21, 1992
Sold by
Breehl Tyra K and Breehl Joseph L
Bought by
Eynon Harry E
Purchase Details
Closed on
Jun 24, 1991
Sold by
Mercer Sarah J-Tyra Breehl-Jam
Bought by
Breehl Tyra K and Breehl Joseph L
Purchase Details
Closed on
Jun 12, 1991
Sold by
Simmons Donna Mae and Simmons Sarah J
Bought by
Mercer Sarah J-Tyra Breehl-Jam
Purchase Details
Closed on
Jan 26, 1990
Sold by
Simmons Donna Mae and Weig Norma
Bought by
Scriven Cindy A and Simmons Sarah J
Create a Home Valuation Report for This Property
The Home Valuation Report is an in-depth analysis detailing your home's value as well as a comparison with similar homes in the area
Home Values in the Area
Average Home Value in this Area
Purchase History
| Date | Buyer | Sale Price | Title Company |
|---|---|---|---|
| Scriven Cindy A | $56,300 | -- | |
| Mcinturf Jan | $54,300 | -- | |
| Eynon Harry E | $54,600 | -- | |
| Breehl Tyra K | $17,500 | -- | |
| Mercer Sarah J-Tyra Breehl-Jam | -- | -- | |
| Scriven Cindy A | $60,000 | -- |
Source: Public Records
Mortgage History
| Date | Status | Borrower | Loan Amount |
|---|---|---|---|
| Previous Owner | Scriven Cindy A | $66,258 | |
| Previous Owner | Mcinturf Jan | $56,300 |
Source: Public Records
Tax History
| Year | Tax Paid | Tax Assessment Tax Assessment Total Assessment is a certain percentage of the fair market value that is determined by local assessors to be the total taxable value of land and additions on the property. | Land | Improvement |
|---|---|---|---|---|
| 2024 | $1,328 | $86,470 | $26,220 | $60,250 |
| 2023 | $1,328 | $86,470 | $26,220 | $60,250 |
| 2022 | $1,343 | $30,265 | $9,177 | $21,088 |
| 2021 | $1,211 | $25,617 | $7,249 | $18,368 |
| 2020 | $1,211 | $25,617 | $7,249 | $18,368 |
| 2019 | $1,220 | $25,617 | $7,249 | $18,368 |
| 2018 | $1,089 | $21,620 | $6,120 | $15,500 |
| 2017 | $1,089 | $21,620 | $6,120 | $15,500 |
| 2016 | $1,091 | $21,620 | $6,120 | $15,500 |
| 2014 | $890 | $19,090 | $5,810 | $13,280 |
| 2013 | $903 | $19,090 | $5,810 | $13,280 |
Source: Public Records
Map
Nearby Homes
- 601 E 4th St
- 214 Poplar St
- 715 N Walnut St
- 311 Lloyd St
- 201 E 12th St
- 1202 N Wooster Ave
- 835 Chelsea Dr
- 334 W 4th St
- 806 Forrest Ridge Dr
- 0 Oxford St Unit 5186285
- 1220 Chestnut St
- 118 Rear Prospect St
- 120 Prospect St
- 3689 Reichman Dr NW
- 3030 N Wooster Ave
- 401 E 18th St
- 605 Bond St
- 312 E 21st St
- 1814 Saltwell Rd NW
- 107 W 21st St
Your Personal Tour Guide
Ask me questions while you tour the home.