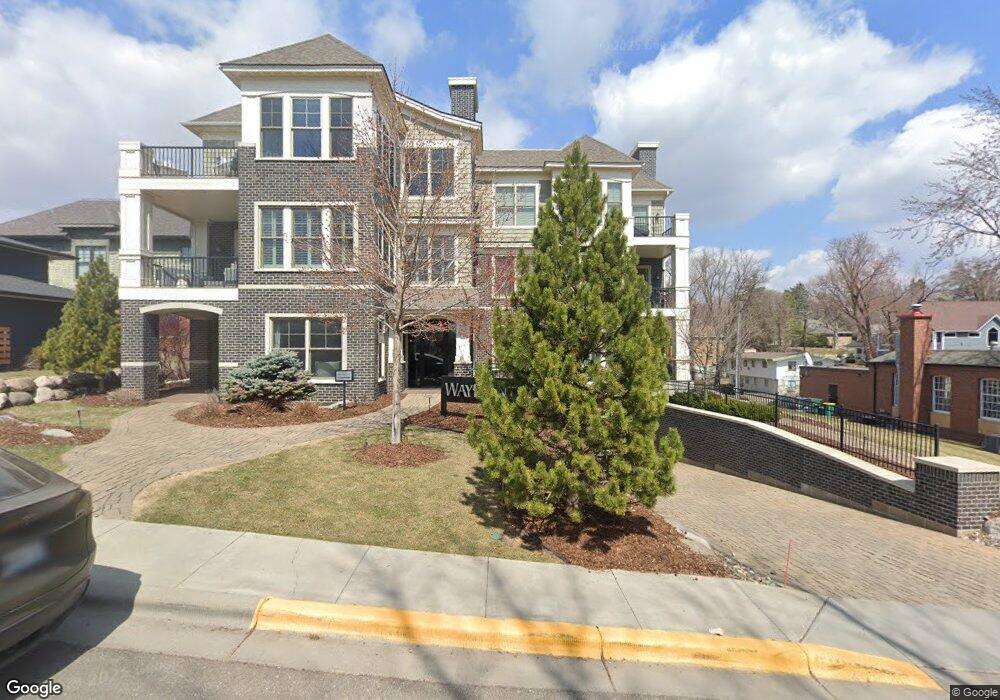
415 Indian Mound St Unit 202 Wayzata, MN 55391
Estimated Value: $1,155,000 - $1,234,000
2
Beds
2
Baths
1,921
Sq Ft
$623/Sq Ft
Est. Value
About This Home
This home is located at 415 Indian Mound St Unit 202, Wayzata, MN 55391 and is currently estimated at $1,196,281, approximately $622 per square foot. 415 Indian Mound St Unit 202 is a home located in Hennepin County with nearby schools including Gleason Lake Elementary School, Wayzata West Middle School, and Wayzata High School.
Ownership History
Date
Name
Owned For
Owner Type
Purchase Details
Closed on
Mar 24, 2023
Sold by
Mackenzie Julie Powell and Mackenzie Andrew
Bought by
Dancing Trust
Current Estimated Value
Purchase Details
Closed on
Nov 5, 2020
Sold by
Becquer Kim M and The Restatement Of Kim M Becqu
Bought by
Mackenzie Andrew and Mackenzie Julie Powell
Home Financials for this Owner
Home Financials are based on the most recent Mortgage that was taken out on this home.
Original Mortgage
$510,400
Interest Rate
2.8%
Mortgage Type
New Conventional
Purchase Details
Closed on
Apr 11, 2019
Sold by
Murphy Ann Marie and The Ann Marie Murphy Trust
Bought by
Becquer Kim M and Kim M Becquer Trust
Purchase Details
Closed on
Jul 12, 2016
Sold by
Murphy Richard M and Murphy Ann Marie
Bought by
Murphy Ann Marie and Ann Marie Murphy Trust
Purchase Details
Closed on
Jul 24, 2015
Sold by
R E C Inc
Bought by
Murphy Ann Marie
Create a Home Valuation Report for This Property
The Home Valuation Report is an in-depth analysis detailing your home's value as well as a comparison with similar homes in the area
Home Values in the Area
Average Home Value in this Area
Purchase History
| Date | Buyer | Sale Price | Title Company |
|---|---|---|---|
| Dancing Trust | $500 | None Listed On Document | |
| Mackenzie Andrew | $990,000 | Executive Title Services | |
| Becquer Kim M | $995,000 | Carver Cnty Abstract & Ttl C | |
| Murphy Ann Marie | -- | None Available | |
| Murphy Ann Marie | $937,876 | Custom Home Bldrs Title | |
| Mackenzie Andrew Andrew | $990,000 | -- |
Source: Public Records
Mortgage History
| Date | Status | Borrower | Loan Amount |
|---|---|---|---|
| Previous Owner | Mackenzie Andrew | $510,400 | |
| Closed | Mackenzie Andrew Andrew | $494,243 |
Source: Public Records
Tax History Compared to Growth
Tax History
| Year | Tax Paid | Tax Assessment Tax Assessment Total Assessment is a certain percentage of the fair market value that is determined by local assessors to be the total taxable value of land and additions on the property. | Land | Improvement |
|---|---|---|---|---|
| 2024 | $14,318 | $1,204,200 | $420,000 | $784,200 |
| 2023 | $13,725 | $1,203,000 | $420,000 | $783,000 |
| 2022 | $13,312 | $1,104,000 | $357,000 | $747,000 |
| 2021 | $12,681 | $1,018,000 | $357,000 | $661,000 |
| 2020 | $12,498 | $977,000 | $357,000 | $620,000 |
| 2019 | $12,325 | $932,000 | $315,000 | $617,000 |
| 2018 | $12,542 | $917,000 | $311,000 | $606,000 |
| 2017 | $12,569 | $914,000 | $385,000 | $529,000 |
| 2016 | $8,319 | $616,000 | $385,000 | $231,000 |
| 2015 | $2,247 | $149,000 | $85,000 | $64,000 |
Source: Public Records
Map
Nearby Homes
- 123 Minnetonka Ave S
- 415 Indian Mound St Unit 203
- 540 Rice St E
- 221 Manitoba Ave
- 105 Walker Ave N
- 132 Minnetonka Ave N
- 296 Grace Pointe Ct
- 205 Barry Ave S Unit 208
- 205 Barry Ave S Unit 210
- 205 Barry Ave S Unit 305
- 150 Broadway Ave S Unit 2B
- 150 Broadway Ave S
- 150 Broadway Ave S Unit 2A
- 150 Broadway Ave S Unit 3D
- 270 Wayzata Blvd E
- 641 Park St E
- 215 Barry Ave S Unit 104
- 638 Gardner St
- 607 Gardner St
- 724 Widsten Cir
- 415 Indian Mound St
- 415 Indian Mound St Unit 101
- 415 415 Indian Mound St
- 230 Manitoba Ave Unit 220
- 230 Manitoba Ave Unit 210
- 230 Manitoba Ave Unit SOUTH
- 230 Manitoba Ave Unit NORTH
- 230 Manitoba Ave Unit 120
- 230 Manitoba Ave S #210 + 220
- 230 230 Manitoba Ave
- 230 230 Manitoba-Avenue-
- 240 Manitoba Ave
- 412 Rice St E
- 420 Rice St E
- 206 Manitoba Ave
- 426 Rice St E
- 225 Manitoba Ave
- 211 Manitoba Ave
- 209 Manitoba Ave
- 231 Manitoba Ave