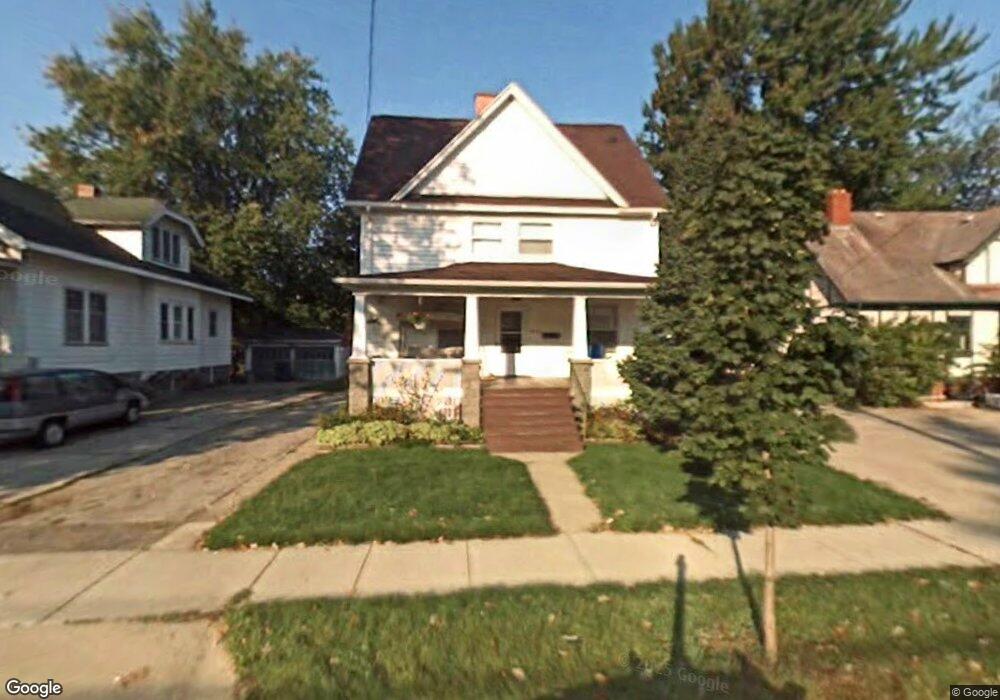
415 N Trumbull St Bay City, MI 48708
Estimated Value: $120,000 - $146,070
3
Beds
2
Baths
1,568
Sq Ft
$82/Sq Ft
Est. Value
About This Home
This home is located at 415 N Trumbull St, Bay City, MI 48708 and is currently estimated at $128,018, approximately $81 per square foot. 415 N Trumbull St is a home located in Bay County with nearby schools including Washington Elementary School, Handy Middle School, and Bay City Central High School.
Ownership History
Date
Name
Owned For
Owner Type
Purchase Details
Closed on
Aug 4, 2016
Sold by
Bryce Kristie R
Bought by
Nix Cornelius D
Current Estimated Value
Purchase Details
Closed on
Oct 31, 2011
Sold by
Fannie Mae
Bought by
Nix Cornelius D and Bryce Kristie R
Home Financials for this Owner
Home Financials are based on the most recent Mortgage that was taken out on this home.
Original Mortgage
$26,800
Interest Rate
4.02%
Mortgage Type
New Conventional
Purchase Details
Closed on
Aug 25, 2010
Sold by
Chemical Bank
Bought by
Federal National Mortgage Association
Purchase Details
Closed on
Aug 20, 2010
Sold by
Zuraw Michael and Zuraw Michael J
Bought by
Chemical Bank and Chemical Bank & Trust Company
Purchase Details
Closed on
Oct 13, 2000
Sold by
Vanlaan Barbara
Bought by
Zuraw Michael
Create a Home Valuation Report for This Property
The Home Valuation Report is an in-depth analysis detailing your home's value as well as a comparison with similar homes in the area
Home Values in the Area
Average Home Value in this Area
Purchase History
| Date | Buyer | Sale Price | Title Company |
|---|---|---|---|
| Nix Cornelius D | -- | None Available | |
| Nix Cornelius D | $33,000 | Attorneys Title Agency Llc | |
| Federal National Mortgage Association | -- | None Available | |
| Chemical Bank | $49,932 | None Available | |
| Zuraw Michael | $69,900 | -- |
Source: Public Records
Mortgage History
| Date | Status | Borrower | Loan Amount |
|---|---|---|---|
| Previous Owner | Nix Cornelius D | $26,800 |
Source: Public Records
Tax History Compared to Growth
Tax History
| Year | Tax Paid | Tax Assessment Tax Assessment Total Assessment is a certain percentage of the fair market value that is determined by local assessors to be the total taxable value of land and additions on the property. | Land | Improvement |
|---|---|---|---|---|
| 2025 | $1,469 | $53,350 | $0 | $0 |
| 2024 | $1,209 | $47,250 | $0 | $0 |
| 2023 | $1,151 | $41,400 | $0 | $0 |
| 2022 | $1,322 | $37,450 | $0 | $0 |
| 2021 | $1,243 | $35,250 | $35,250 | $0 |
| 2020 | $1,322 | $32,100 | $32,100 | $0 |
| 2019 | $1,293 | $29,950 | $0 | $0 |
| 2018 | $1,280 | $29,700 | $0 | $0 |
| 2017 | $1,252 | $29,250 | $0 | $0 |
| 2016 | $1,246 | $25,300 | $0 | $25,300 |
| 2015 | $1,449 | $26,500 | $0 | $26,500 |
| 2014 | $1,449 | $30,450 | $0 | $30,450 |
Source: Public Records
Map
Nearby Homes
- 411 N Trumbull St
- 1872 Mckinley St
- 1868 Mckinley St
- 1862 Mckinley St
- 1867 9th St
- 401 N Trumbull St
- 412 N Trumbull St
- 414 N Trumbull St
- 416 N Trumbull St
- 418 N Trumbull St
- 1863 9th St
- 404 N Trumbull St
- 2106 Mckinley St
- 500 N Trumbull St
- 1861 9th St
- 1873 Mckinley St
- 1852 Mckinley St
- 1870 9th St
- 2108 Mckinley St
- 1872 9th St