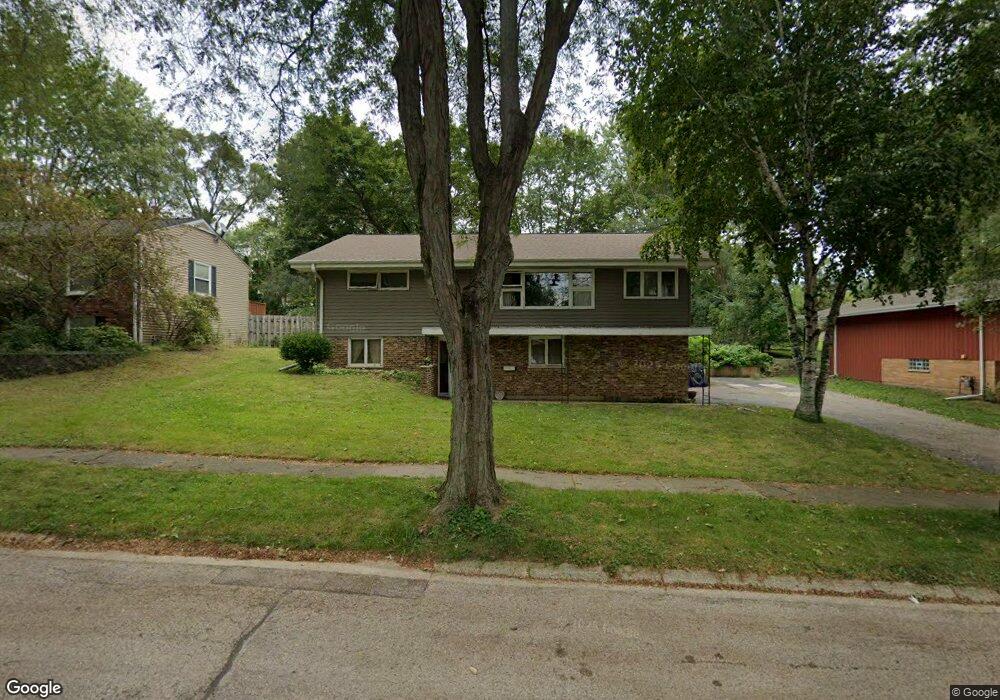
417 James Ct Algonquin, IL 60102
Estimated Value: $338,606 - $430,000
5
Beds
2
Baths
1,575
Sq Ft
$236/Sq Ft
Est. Value
About This Home
This home is located at 417 James Ct, Algonquin, IL 60102 and is currently estimated at $371,402, approximately $235 per square foot. 417 James Ct is a home located in McHenry County with nearby schools including Eastview Elementary School, Algonquin Middle School, and Dundee-Crown High School.
Ownership History
Date
Name
Owned For
Owner Type
Purchase Details
Closed on
Jan 8, 2008
Sold by
Niequist Daniel A and Niequist Diane L
Bought by
Olson Keith and Olson Josephine
Current Estimated Value
Home Financials for this Owner
Home Financials are based on the most recent Mortgage that was taken out on this home.
Original Mortgage
$189,600
Outstanding Balance
$119,492
Interest Rate
6.13%
Mortgage Type
Unknown
Estimated Equity
$251,910
Purchase Details
Closed on
Jun 29, 1995
Sold by
Bolz James M and Daniels David B
Bought by
Niequist Daniel A and Niequist Diane L
Home Financials for this Owner
Home Financials are based on the most recent Mortgage that was taken out on this home.
Original Mortgage
$135,685
Interest Rate
7.9%
Mortgage Type
FHA
Create a Home Valuation Report for This Property
The Home Valuation Report is an in-depth analysis detailing your home's value as well as a comparison with similar homes in the area
Purchase History
| Date | Buyer | Sale Price | Title Company |
|---|---|---|---|
| Olson Keith | $237,000 | Chicago Title Insurance Co | |
| Niequist Daniel A | $140,000 | -- |
Source: Public Records
Mortgage History
| Date | Status | Borrower | Loan Amount |
|---|---|---|---|
| Open | Olson Keith | $189,600 | |
| Previous Owner | Niequist Daniel A | $135,685 |
Source: Public Records
Tax History
| Year | Tax Paid | Tax Assessment Tax Assessment Total Assessment is a certain percentage of the fair market value that is determined by local assessors to be the total taxable value of land and additions on the property. | Land | Improvement |
|---|---|---|---|---|
| 2024 | $7,077 | $98,467 | $13,570 | $84,897 |
| 2023 | $6,703 | $88,067 | $12,137 | $75,930 |
| 2022 | $6,141 | $77,605 | $16,092 | $61,513 |
| 2021 | $5,883 | $72,299 | $14,992 | $57,307 |
| 2020 | $5,723 | $69,739 | $14,461 | $55,278 |
| 2019 | $5,578 | $66,749 | $13,841 | $52,908 |
| 2018 | $5,306 | $61,662 | $12,786 | $48,876 |
| 2017 | $5,187 | $58,089 | $12,045 | $46,044 |
| 2016 | $5,098 | $54,482 | $11,297 | $43,185 |
| 2013 | -- | $54,117 | $10,539 | $43,578 |
Source: Public Records
Map
Nearby Homes
- 719 Webster St
- 600 E Algonquin Rd
- 407 La Fox River Dr
- 21 Division St
- 0 River Dr N Unit MRD12473279
- 1188 E Algonquin Rd
- 953 Old Oak Cir
- 0 Natoma Trail
- lot 25 Wabican Trail
- Lot #3-5 Hayes Rd
- 1200 Hillside View
- 1031 Timberwood Ln
- Lot 4 b Ryan Pkwy
- 1420 Greenridge Ave
- 1770 E Algonquin Rd
- 615 Harper Dr
- 720 Ash St
- 730 Chestnut Ct
- 1730 Tanglewood Dr
- 308 Rustic Ln
Your Personal Tour Guide
Ask me questions while you tour the home.