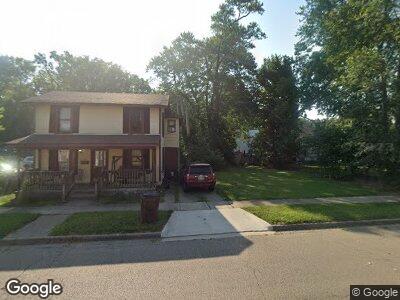
418 Anderson St Franklin, OH 45005
Estimated Value: $152,048 - $232,000
4
Beds
1
Bath
2,616
Sq Ft
$73/Sq Ft
Est. Value
About This Home
This home is located at 418 Anderson St, Franklin, OH 45005 and is currently estimated at $192,016, approximately $73 per square foot. 418 Anderson St is a home located in Warren County with nearby schools including Franklin High School and The CinDay Academy.
Ownership History
Date
Name
Owned For
Owner Type
Purchase Details
Closed on
Jan 26, 2015
Sold by
Emond Lovelace Iii and Lovelace Robin
Bought by
Wolfinbarger Mark A and Wolfinbarger Amber D
Current Estimated Value
Home Financials for this Owner
Home Financials are based on the most recent Mortgage that was taken out on this home.
Original Mortgage
$44,363
Outstanding Balance
$35,289
Interest Rate
4.37%
Mortgage Type
FHA
Estimated Equity
$150,046
Purchase Details
Closed on
Jun 19, 2009
Sold by
Lovelace Elmond and Lovelace Elmond E
Bought by
Lovelace Elmond
Purchase Details
Closed on
Nov 15, 2001
Sold by
Beneficial Mtg Co Of Ohi
Bought by
Lovelace Elmond E
Home Financials for this Owner
Home Financials are based on the most recent Mortgage that was taken out on this home.
Original Mortgage
$33,600
Interest Rate
6.69%
Mortgage Type
New Conventional
Create a Home Valuation Report for This Property
The Home Valuation Report is an in-depth analysis detailing your home's value as well as a comparison with similar homes in the area
Home Values in the Area
Average Home Value in this Area
Purchase History
| Date | Buyer | Sale Price | Title Company |
|---|---|---|---|
| Wolfinbarger Mark A | $45,000 | None Available | |
| Lovelace Elmond | -- | Attorney | |
| Lovelace Elmond E | $42,000 | -- |
Source: Public Records
Mortgage History
| Date | Status | Borrower | Loan Amount |
|---|---|---|---|
| Open | Wolfinbarger Mark A | $44,363 | |
| Previous Owner | Lovelace Elmond E | $33,600 |
Source: Public Records
Tax History Compared to Growth
Tax History
| Year | Tax Paid | Tax Assessment Tax Assessment Total Assessment is a certain percentage of the fair market value that is determined by local assessors to be the total taxable value of land and additions on the property. | Land | Improvement |
|---|---|---|---|---|
| 2024 | $1,767 | $33,250 | $6,790 | $26,460 |
| 2023 | $1,541 | $25,522 | $3,850 | $21,672 |
| 2022 | $1,515 | $25,522 | $3,850 | $21,672 |
| 2021 | $1,447 | $25,522 | $3,850 | $21,672 |
| 2020 | $1,323 | $20,255 | $3,056 | $17,199 |
| 2019 | $1,019 | $20,255 | $3,056 | $17,199 |
| 2018 | $1,021 | $20,255 | $3,056 | $17,199 |
| 2017 | $1,053 | $19,131 | $2,937 | $16,195 |
| 2016 | $1,074 | $19,131 | $2,937 | $16,195 |
| 2015 | $1,099 | $19,131 | $2,937 | $16,195 |
| 2014 | $1,127 | $19,130 | $2,940 | $16,190 |
| 2013 | $960 | $22,140 | $3,400 | $18,740 |
Source: Public Records
Map
Nearby Homes
- 0 Riley Blvd
- 625 S Main St
- 233 S Main St
- 235 S Main St
- 743 S Main St
- 820 S River St
- 10 S River St
- 418 Park Ave
- 1501 Knightsbridge Ct
- 0 Kathy Ln Unit 930066
- 0 Kathy Ln Unit 1834240
- 759 David Blvd
- 3059 Canvasback Ct
- 608 Park Ave
- 185 Beam Dr
- 315 Bridge St
- 103 Warren Ave
- 115 Warren Ave
- 215 E Bryant Ave
- 141 Arlington Ave