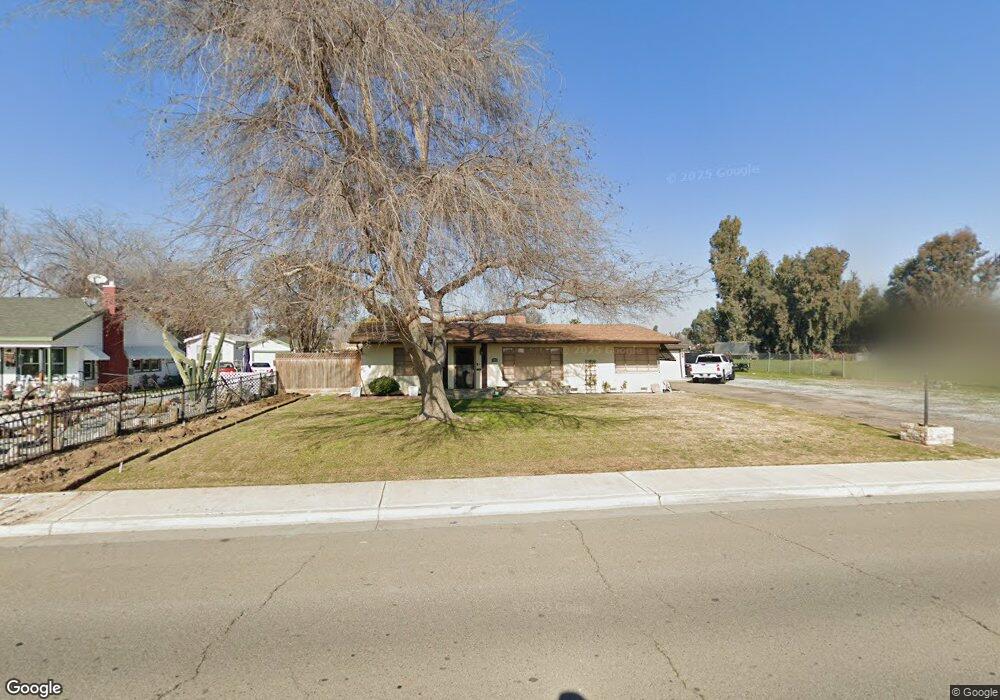
418 E Bush St Lemoore, CA 93245
Estimated Value: $307,000 - $382,000
2
Beds
2
Baths
1,700
Sq Ft
$206/Sq Ft
Est. Value
About This Home
This home is located at 418 E Bush St, Lemoore, CA 93245 and is currently estimated at $349,534, approximately $205 per square foot. 418 E Bush St is a home located in Kings County with nearby schools including Lemoore Elementary School, Liberty Middle School, and Lemoore High School.
Ownership History
Date
Name
Owned For
Owner Type
Purchase Details
Closed on
Jan 23, 2021
Sold by
Munoz Jorge B and Munoz Amparo C
Bought by
Munoz Marcos
Current Estimated Value
Purchase Details
Closed on
Jul 8, 2004
Sold by
Munoz Jorge B and Munoz Amparo C
Bought by
Munoz Jorge B and Munoz Amparo C
Purchase Details
Closed on
Jun 11, 1998
Sold by
Hamblin Roy W
Bought by
Munoz Jorge B and Munoz Amparo C
Purchase Details
Closed on
Jun 3, 1998
Sold by
Hamblin Roy W
Bought by
Polder J Bruce and Polder Lisa Z
Create a Home Valuation Report for This Property
The Home Valuation Report is an in-depth analysis detailing your home's value as well as a comparison with similar homes in the area
Home Values in the Area
Average Home Value in this Area
Purchase History
| Date | Buyer | Sale Price | Title Company |
|---|---|---|---|
| Munoz Marcos | -- | None Available | |
| Munoz Jorge B | -- | None Available | |
| Munoz Jorge B | -- | -- | |
| Munoz Jorge B | $80,000 | Chicago Title Co | |
| Polder J Bruce | $4,000 | Chicago Title Co |
Source: Public Records
Tax History
| Year | Tax Paid | Tax Assessment Tax Assessment Total Assessment is a certain percentage of the fair market value that is determined by local assessors to be the total taxable value of land and additions on the property. | Land | Improvement |
|---|---|---|---|---|
| 2025 | $1,296 | $127,736 | $44,707 | $83,029 |
| 2023 | $1,296 | $122,777 | $42,972 | $79,805 |
| 2022 | $1,360 | $120,371 | $42,130 | $78,241 |
| 2021 | $1,326 | $118,011 | $41,304 | $76,707 |
| 2020 | $1,318 | $116,800 | $40,880 | $75,920 |
| 2019 | $1,308 | $114,509 | $40,078 | $74,431 |
| 2018 | $1,229 | $112,264 | $39,292 | $72,972 |
| 2017 | $1,232 | $110,063 | $38,522 | $71,541 |
| 2016 | $1,159 | $107,905 | $37,767 | $70,138 |
| 2015 | $1,154 | $106,284 | $37,200 | $69,084 |
| 2014 | $1,121 | $104,202 | $36,471 | $67,731 |
Source: Public Records
Map
Nearby Homes
Your Personal Tour Guide
Ask me questions while you tour the home.