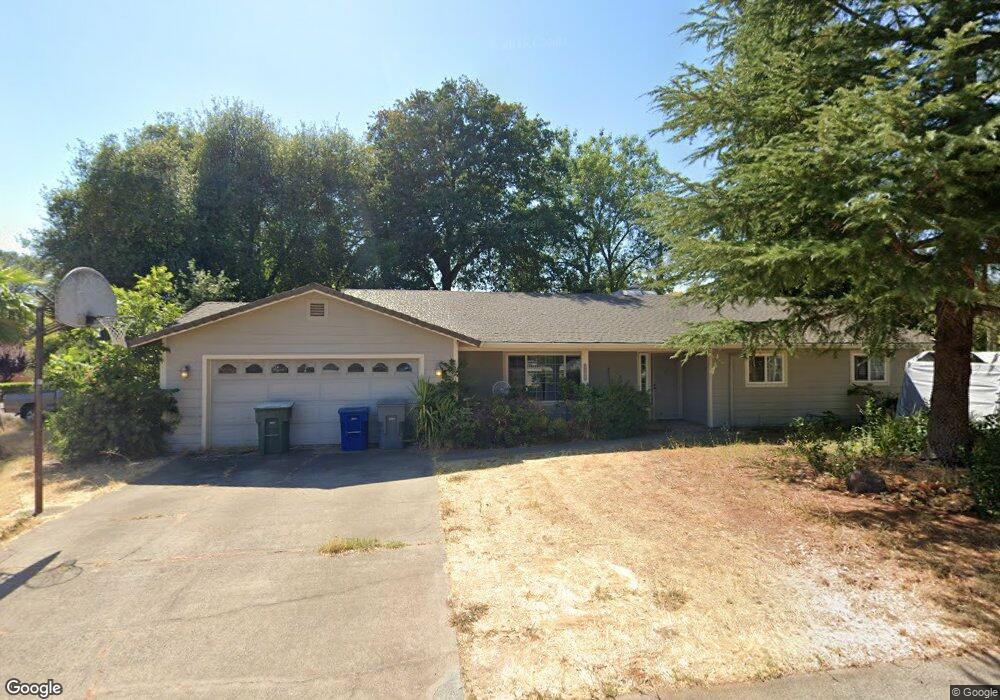
4190 James Place Redding, CA 96002
Enterprise NeighborhoodEstimated Value: $360,000 - $378,000
3
Beds
2
Baths
1,750
Sq Ft
$212/Sq Ft
Est. Value
About This Home
This home is located at 4190 James Place, Redding, CA 96002 and is currently estimated at $370,272, approximately $211 per square foot. 4190 James Place is a home located in Shasta County with nearby schools including Lassen View Elementary School, Parsons Junior High School, and Enterprise High School.
Ownership History
Date
Name
Owned For
Owner Type
Purchase Details
Closed on
Dec 31, 2012
Sold by
Diperry John and Diperry Kathleen Stephanie
Bought by
Diperry John Anthony and Diperry Tracy Lynn
Current Estimated Value
Home Financials for this Owner
Home Financials are based on the most recent Mortgage that was taken out on this home.
Original Mortgage
$165,000
Outstanding Balance
$112,600
Interest Rate
3.28%
Mortgage Type
Seller Take Back
Estimated Equity
$257,672
Purchase Details
Closed on
Nov 24, 2004
Sold by
Diperry John and Diperry Kathleen
Bought by
Diperry John and Diperry Kathleen Stephanie
Purchase Details
Closed on
Oct 5, 2004
Sold by
Kangris Phillip and Kangris Sandy
Bought by
Diperry John and Diperry Kathleen
Purchase Details
Closed on
Nov 14, 2002
Sold by
James Robert C and James Rose
Bought by
Kangris Phillip and Kangris Sandy
Home Financials for this Owner
Home Financials are based on the most recent Mortgage that was taken out on this home.
Original Mortgage
$153,805
Interest Rate
8%
Create a Home Valuation Report for This Property
The Home Valuation Report is an in-depth analysis detailing your home's value as well as a comparison with similar homes in the area
Home Values in the Area
Average Home Value in this Area
Purchase History
| Date | Buyer | Sale Price | Title Company |
|---|---|---|---|
| Diperry John Anthony | $165,000 | None Available | |
| Diperry John | -- | -- | |
| Diperry John | $213,000 | Chicago Title Co | |
| Kangris Phillip | $162,000 | Placer Title Company |
Source: Public Records
Mortgage History
| Date | Status | Borrower | Loan Amount |
|---|---|---|---|
| Open | Diperry John Anthony | $165,000 | |
| Previous Owner | Kangris Phillip | $153,805 |
Source: Public Records
Tax History
| Year | Tax Paid | Tax Assessment Tax Assessment Total Assessment is a certain percentage of the fair market value that is determined by local assessors to be the total taxable value of land and additions on the property. | Land | Improvement |
|---|---|---|---|---|
| 2025 | $2,220 | $203,173 | $36,938 | $166,235 |
| 2024 | $2,189 | $199,190 | $36,214 | $162,976 |
| 2023 | $2,189 | $195,285 | $35,504 | $159,781 |
| 2022 | $2,127 | $191,457 | $34,808 | $156,649 |
| 2021 | $2,055 | $187,704 | $34,126 | $153,578 |
| 2020 | $2,046 | $185,781 | $33,777 | $152,004 |
| 2019 | $2,030 | $182,139 | $33,115 | $149,024 |
| 2018 | $2,006 | $178,568 | $32,466 | $146,102 |
| 2017 | $2,042 | $175,068 | $31,830 | $143,238 |
| 2016 | $1,910 | $171,636 | $31,206 | $140,430 |
| 2015 | $1,894 | $169,059 | $30,738 | $138,321 |
| 2014 | $1,881 | $165,748 | $30,136 | $135,612 |
Source: Public Records
Map
Nearby Homes
- 4302 Paulson Ln
- 4323 Churn Crk Rd
- 1289 Arizona St
- 4724 Squirrel Run Ct
- 1513 Harpole Rd
- 751 Woodacre Dr
- 1354 Harpole Rd
- 4877 Squirrel Run Ct
- 607 Woodacre Dr
- 4624 Columbine Dr
- 4487 Alta Saga Dr
- 4608 Dandelion Dr
- 99999 Churn Creek Rd
- 4648 Dandelion Dr
- 737 Estate St
- 688 Julie Way
- 3708 Traverse St
- 3527 Adams Ln
- 952 Camino Ct
- 3528 Silverwood St
- 1360 Dominion Dr
- 1391 Denton Way
- 1344 Dominion Dr
- 1373 Denton Way
- 4189 James Place
- 4203 James Place
- 1377 Dominion Dr
- 4163 James Place
- 1355 Denton Way
- 1361 Dominion Dr
- 1389 Dominion Dr
- 1401 Dominion Dr
- 1326 Dominion Dr
- 1343 Dominion Dr Unit 3
- 4147 James Place
- 1337 Denton Way
- 1325 Dominion Dr
- 1378 Denton Way
- 1394 Denton Way
- 1362 Denton Way
Your Personal Tour Guide
Ask me questions while you tour the home.