
OPEN SAT 2PM - 4PM
$100K PRICE DROP
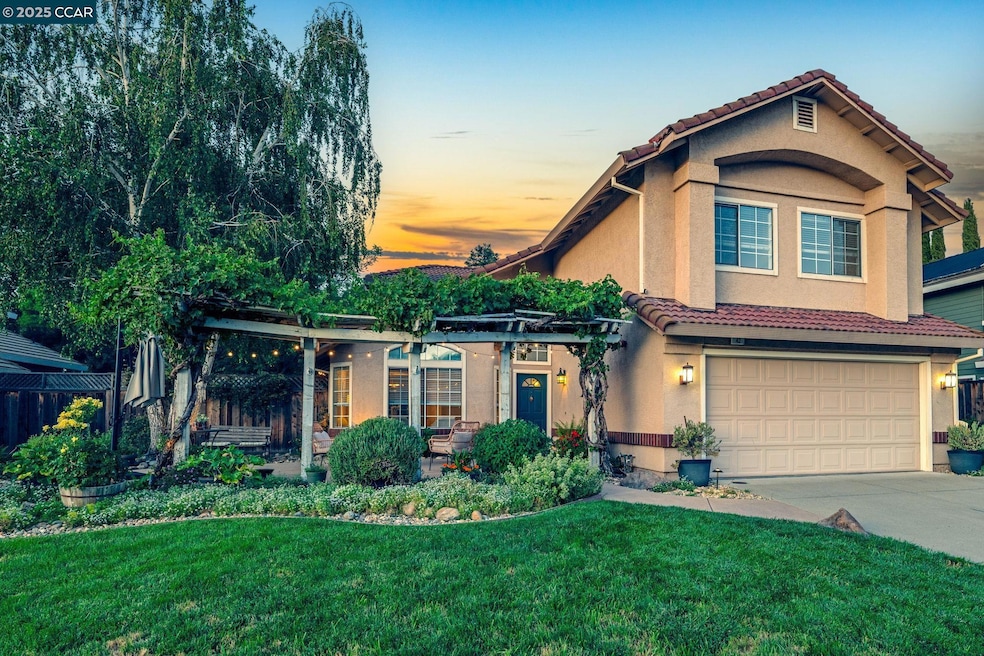
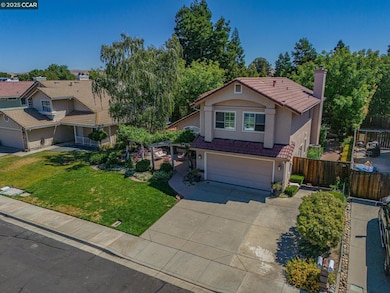
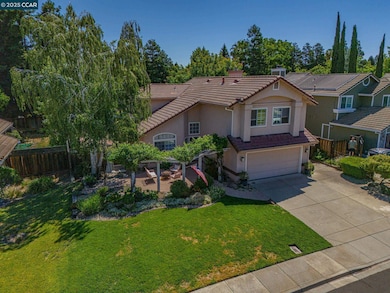
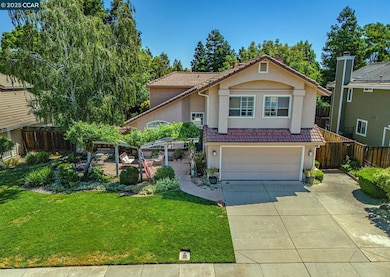
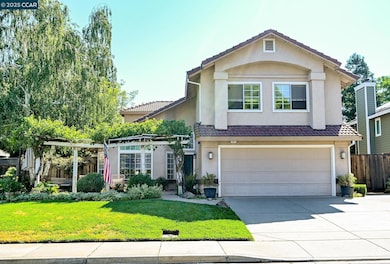
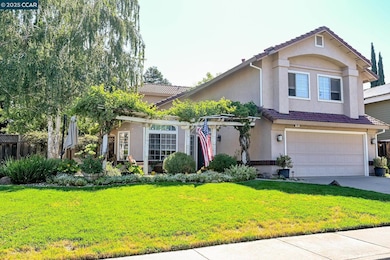
42 Alysia Ct Livermore, CA 94550
Autumn Valley NeighborhoodEstimated payment $8,391/month
Total Views
14,449
4
Beds
2.5
Baths
2,246
Sq Ft
$623
Price per Sq Ft
Highlights
- Panoramic View
- Updated Kitchen
- Private Lot
- Arroyo Seco Elementary School Rated A-
- Contemporary Architecture
- Solid Surface Countertops
About This Home
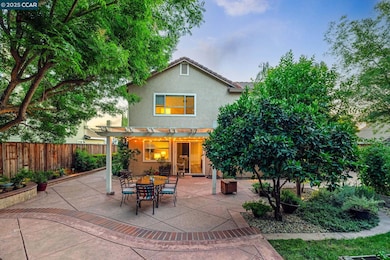
***PRICE REDUCED $100K***WELCOME TO AUTUMN VALLEY, A PREMIER NEIGHBORHOOD NEAR SCHOOLS,ACE TRAIN,WINERIES, SHOPPNG, LAWRENCE LIVRMR LAB, DWNTWN W/ EASY COMMUTE ACCESS*THIS STUNNING 2- STRY IS SITUATED ON A QUIET, CRT STR! THE SOUGHT-AFTR 'PRIMROSE' MODL HAS OPEN FLR PLAN W/4 BR'S, 2.5 BATHS, VLTD CEILNGS, WOOD BLINDS, NEWR DARK LAMINATE-WOOD FLRS,CRPTG,TILE*PRIMRY SUITE BATH HAS DUAL VANITIES, OVAL TUB, SEP SHWR & WTR CLOSET! SPAC FRML LIV RM & DN RM PERFECT FOR ENTERTAINING! LG FAM RM HAS WOOD-BRNG FRPL & PATIO DR LEADG TO LARGE,COVRD STONE & BRICK PATIO,W/MANY BEAUTIFUL PLANTINGS: MEYR LEMON,JAP MAPLE, FLOWRING PLANTS,RAISD VEG GARDNS*OPN CHEF'S KTCHN HAS DARK WOOD CAB DRS, CO RIAN CNTRS, NWR REF, GE PROFILE DW,COOKTP, +LG BRKFST BAR,INFRML DINING,TILE FLRS*UPRLVL W/ 4 LG BR'S 2 FULL BATHS*LG 2-CAR ATT GAR*NWR LENNOX HIGH EFF HV AC*NWR 50 GAL HWH*STR SHED STAYS*FAB GARDENS & STONE PATIOS FRONT/BACK*MANY UPGRADES***HURRY .. WON'T LAST***
Open House Schedule
-
Saturday, July 19, 20252:00 to 4:00 pm7/19/2025 2:00:00 PM +00:007/19/2025 4:00:00 PM +00:00***REDUCED $100K***OPEN SAT 2 - 4 , SUN 11 - 1 PM***WELCOME TO AUTUMN VALLEY, A PREMIER NEIGHBORHOOD NEAR SCHOOLS, SHOPPNG, LAWRENCE LIVRMR LAB, DWNTWN W/ EASY COMMUTE ACCESS*THIS STUNNING 2- STRY IS SITUATED ON A QUIET, CRT STR! THE SOUGHT-AFTR 'PRIMROSE' MODL HAS OPEN FLR PLAN W/4 BR'S, 2.5 BATHS, VLTD CEILNGS, WOOD BLINDS, NEWR DARK LAMINATE-WOOD FLRS,CRPTG,TILE*PRIMRY SUITE BATH HAS DUAL VANITIES, OVAL TUB, SEP SHWR & WTR CLOSET! SPAC FRML LIV RM & DN RM PERFECT FOR ENTERTAINING! LG FAM RM HAS WOOD-BRNG FRPL & PATIO DR LEADG TO LARGE,COVRD STONE & BRICK PATIO,W/MANY BEAUTIFUL PLANTINGS: MEYR LEMON,JAP MAPLE, FLOWRING PLANTS,RAISD VEG GARDNS*OPN CHEF'S KTCHN HAS DARK WOOD CAB DRS, CO RIAN CNTRS, NWR REF, GE PROFILE DW,COOKTP, +LG BRKFST BAR,INFRML DINING,TILE FLRS*UPRLVL W/ 4 LG BR'S 2 FULL BATHS*LG 2-CAR ATT GAR*NWR LENNOX HIGH EFF HV AC*NWR 50 GAL HWH*STR SHED STAYS*FAB GARDENS & STONE PATIOS FRONT/BACK*MANY UPGRADES***HURRY .. WON'T LAST***Add to Calendar
-
Sunday, July 20, 202511:00 am to 1:00 pm7/20/2025 11:00:00 AM +00:007/20/2025 1:00:00 PM +00:00***REDUCED $100K***OPEN SUN 11AM - 1 PM***WELCOME TO AUTUMN VALLEY A PREMIER NEIGHBORHOOD NEAR SCHOOLS, ACE TRAIN, WINERIES, SHOPPING, LAWRENCE LIV LAB,DOWNTN,EASY COMMUTE ACCESS*QUIET COURT STREET*4 BEDROOMS, 2.5 BATHS*FABULOUS GARDENS AND PATIOS, HARDSCAPE*COME TODAY*Add to Calendar
Home Details
Home Type
- Single Family
Est. Annual Taxes
- $7,970
Year Built
- Built in 1993
Lot Details
- 7,480 Sq Ft Lot
- Private Lot
- Secluded Lot
- Back and Front Yard
Parking
- 2 Car Direct Access Garage
- Front Facing Garage
- Garage Door Opener
Home Design
- Contemporary Architecture
- Slab Foundation
- Ceiling Insulation
- Tile Roof
- Stucco
Interior Spaces
- 2-Story Property
- Wood Burning Fireplace
- Window Screens
- Family Room with Fireplace
- Panoramic Views
Kitchen
- Updated Kitchen
- Breakfast Area or Nook
- Breakfast Bar
- Built-In Oven
- Electric Cooktop
- Dishwasher
- Solid Surface Countertops
Flooring
- Carpet
- Laminate
- Tile
Bedrooms and Bathrooms
- 4 Bedrooms
Laundry
- Laundry in unit
- Dryer
- Washer
- 220 Volts In Laundry
Eco-Friendly Details
- Energy-Efficient Appliances
- Energy-Efficient Insulation
Utilities
- Forced Air Heating and Cooling System
- Heating System Uses Natural Gas
- 220 Volts in Kitchen
- High-Efficiency Water Heater
- Gas Water Heater
Community Details
- No Home Owners Association
- Autumn Valley Subdivision, Primrose Floorplan
Listing and Financial Details
- Assessor Parcel Number 99A291080
Map
Create a Home Valuation Report for This Property
The Home Valuation Report is an in-depth analysis detailing your home's value as well as a comparison with similar homes in the area
Home Values in the Area
Average Home Value in this Area
Tax History
| Year | Tax Paid | Tax Assessment Tax Assessment Total Assessment is a certain percentage of the fair market value that is determined by local assessors to be the total taxable value of land and additions on the property. | Land | Improvement |
|---|---|---|---|---|
| 2024 | $7,970 | $579,349 | $173,880 | $405,469 |
| 2023 | $7,844 | $567,990 | $170,471 | $397,519 |
| 2022 | $7,718 | $556,855 | $167,129 | $389,726 |
| 2021 | $7,556 | $545,939 | $163,852 | $382,087 |
| 2020 | $7,274 | $540,344 | $162,173 | $378,171 |
| 2019 | $7,355 | $529,751 | $158,994 | $370,757 |
| 2018 | $7,192 | $519,366 | $155,877 | $363,489 |
| 2017 | $6,946 | $509,184 | $152,821 | $356,363 |
| 2016 | $6,692 | $499,203 | $149,826 | $349,377 |
| 2015 | $6,261 | $491,705 | $147,575 | $344,130 |
| 2014 | $6,154 | $482,074 | $144,685 | $337,389 |
Source: Public Records
Property History
| Date | Event | Price | Change | Sq Ft Price |
|---|---|---|---|---|
| 07/14/2025 07/14/25 | Price Changed | $1,399,000 | -3.5% | $623 / Sq Ft |
| 07/09/2025 07/09/25 | Price Changed | $1,449,000 | -3.3% | $645 / Sq Ft |
| 06/18/2025 06/18/25 | For Sale | $1,499,000 | -- | $667 / Sq Ft |
Source: Contra Costa Association of REALTORS®
Purchase History
| Date | Type | Sale Price | Title Company |
|---|---|---|---|
| Interfamily Deed Transfer | -- | None Available | |
| Interfamily Deed Transfer | -- | Orange Coast Title Company | |
| Grant Deed | $384,500 | Chicago Title Co |
Source: Public Records
Mortgage History
| Date | Status | Loan Amount | Loan Type |
|---|---|---|---|
| Open | $399,000 | New Conventional | |
| Closed | $414,000 | Unknown | |
| Closed | $427,500 | Purchase Money Mortgage | |
| Closed | $332,700 | Unknown | |
| Closed | $20,000 | Unknown | |
| Closed | $307,600 | No Value Available |
Source: Public Records
Similar Homes in Livermore, CA
Source: Contra Costa Association of REALTORS®
MLS Number: 41101832
APN: 099A-2910-080-00
Disclaimer: Certain information contained herein is derived from information provided by parties other than Homes.com. All information provided is deemed reliable, but is not guaranteed to be accurate and should be independently verified.
![]() Bay East ©2025. BridgeMLS ©2025, CCAR ©2025. Information Deemed Reliable But Not Guaranteed. This information is being provided by the Bay East MLS, BridgeMLS or CCAR MLS. The listings presented here may or may not be listed by the Broker/Agent operating this website. This information is intended for the personal use of consumers, and may not be used for any purpose other than to identify prospective properties consumers may be interested in purchasing.
Bay East ©2025. BridgeMLS ©2025, CCAR ©2025. Information Deemed Reliable But Not Guaranteed. This information is being provided by the Bay East MLS, BridgeMLS or CCAR MLS. The listings presented here may or may not be listed by the Broker/Agent operating this website. This information is intended for the personal use of consumers, and may not be used for any purpose other than to identify prospective properties consumers may be interested in purchasing.
Nearby Homes
- 148 Medina St
- 4667 Laurie Common Unit 104
- 476 Mulqueeney St
- 96 Trixie Dr
- 4772 Nicol Common Unit 101
- 473 Andrea Cir
- 342 Chris Common Unit 109
- 4687 Nicol Common Unit 108
- 530 Andrea Cir
- 4202 Grove Ct
- 4588 Phyllis Ct
- 530 Hazel St
- 127 Sonia Way
- 5241 Felicia Ave
- 5135 Charlotte Way
- 4244 Milton Way
- 5325 Lenore Ave
- 847 Dana Cir
- 4052 Emerson Dr
- 304 Avondale Ln
- 4721 Nicol Common Unit 103
- 219 Hillcrest Ave
- 3909 Portola Common
- 5107 Norma Way
- 3998 East Ave
- 5643 Charlotte Way
- 3670 Silver Oaks Way Unit E
- 3670 Silver Oaks Way
- 5639 Jacquiline Way
- 1089 Bluebell Dr
- 5720 East Ave
- 3819 East Ave
- 1001-1097 Westwind St
- 3550 Pacific Ave
- 2829 Salt Pond Common
- 4085 Bristlecone Way
- 2991 College Ave
- 2389 3rd St Unit street level
- 1446 Chateau Common
- 1446 Chateau Common Unit 104