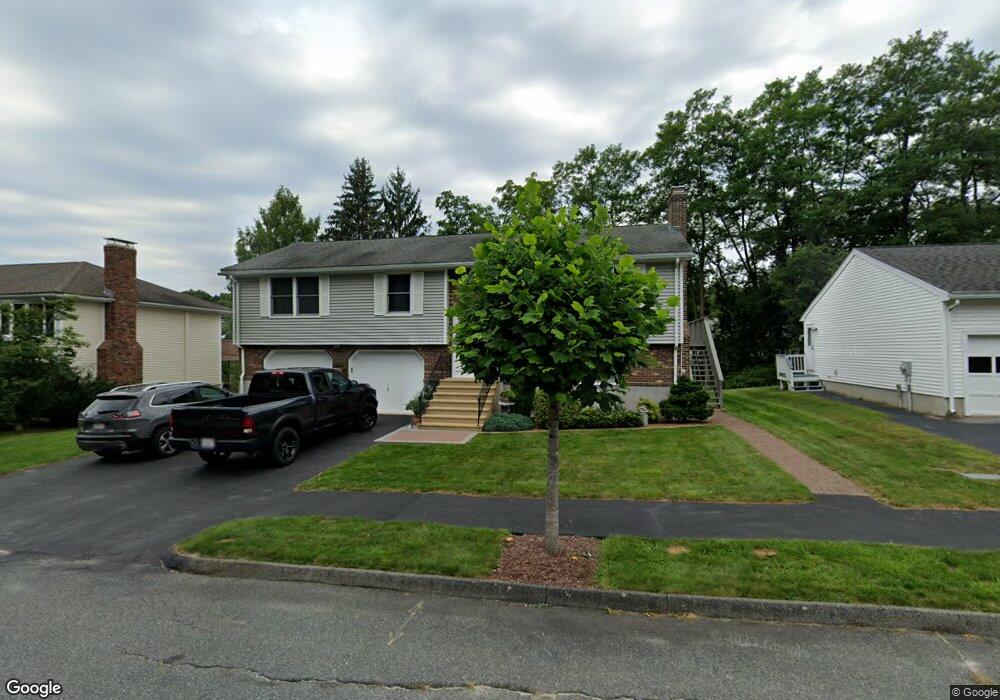
42 Bonnybrook Rd Worcester, MA 01606
Indian Hill NeighborhoodEstimated Value: $481,000 - $533,000
3
Beds
3
Baths
1,445
Sq Ft
$346/Sq Ft
Est. Value
About This Home
This home is located at 42 Bonnybrook Rd, Worcester, MA 01606 and is currently estimated at $499,465, approximately $345 per square foot. 42 Bonnybrook Rd is a home located in Worcester County with nearby schools including Nelson Place Elementary School, Jacob Hiatt Magnet School, and Chandler Magnet.
Ownership History
Date
Name
Owned For
Owner Type
Purchase Details
Closed on
Sep 11, 1987
Sold by
Connor Garry J
Bought by
Kovak W
Current Estimated Value
Home Financials for this Owner
Home Financials are based on the most recent Mortgage that was taken out on this home.
Original Mortgage
$20,000
Interest Rate
10.27%
Mortgage Type
Purchase Money Mortgage
Create a Home Valuation Report for This Property
The Home Valuation Report is an in-depth analysis detailing your home's value as well as a comparison with similar homes in the area
Home Values in the Area
Average Home Value in this Area
Purchase History
We collect this data history from publicly available records. To have your information removed, we recommend requesting removal directly through your county’s website.
| Date | Buyer | Sale Price | Title Company |
|---|---|---|---|
| Kovak W | $169,000 | -- |
Source: Public Records
Mortgage History
We collect this data history from publicly available records. To have your information removed, we recommend requesting removal directly through your county’s website.
| Date | Status | Borrower | Loan Amount |
|---|---|---|---|
| Closed | Kovak W | $20,000 |
Source: Public Records
Tax History
| Year | Tax Paid | Tax Assessment Tax Assessment Total Assessment is a certain percentage of the fair market value that is determined by local assessors to be the total taxable value of land and additions on the property. | Land | Improvement |
|---|---|---|---|---|
| 2025 | $5,905 | $447,700 | $118,400 | $329,300 |
| 2024 | $5,748 | $418,000 | $118,400 | $299,600 |
| 2023 | $5,616 | $391,600 | $102,900 | $288,700 |
| 2022 | $4,977 | $327,200 | $82,400 | $244,800 |
| 2021 | $5,003 | $307,300 | $65,900 | $241,400 |
| 2020 | $4,777 | $281,000 | $65,900 | $215,100 |
| 2019 | $4,666 | $259,200 | $59,300 | $199,900 |
| 2018 | $4,699 | $248,500 | $59,300 | $189,200 |
| 2017 | $4,501 | $234,200 | $59,300 | $174,900 |
| 2016 | $4,470 | $216,900 | $43,400 | $173,500 |
| 2015 | $4,353 | $216,900 | $43,400 | $173,500 |
| 2014 | $4,238 | $216,900 | $43,400 | $173,500 |
Source: Public Records
Map
Nearby Homes
- 142 Holden St
- 144 Holden St
- 1 Brookhaven Rd
- 125 Indian Hill Rd
- 97 Parkton Ave
- 7 Albemarle St
- 13 Mount Ave
- 1 Summerhill Ave
- 61 Nelson Place
- 577 Grove St
- 35 Summerhill Ave
- 46 Hastings Ave
- 35 Boardman St
- 42 Hastings Ave
- 39 Boyd St
- 78 Leeds St
- 28 Greendale Ave
- 46 Jordan Rd
- 26 Fales St
- 32 Indian Lake Pkwy
- 40 Bonnybrook Rd
- 44 Bonnybrook Rd
- 69 Brookhaven Rd
- 63 Brookhaven Rd
- 38 Bonnybrook Rd
- 61 Brookhaven Rd
- 41 Bonnybrook Rd
- 39 Bonnybrook Rd
- 72 Brookhaven Rd
- 36 Bonnybrook Rd
- 70 Brookhaven Rd
- 59 Brookhaven Rd
- 74 Brookhaven Rd
- 37 Bonnybrook Rd
- 68 Brookhaven Rd
- 76 Brookhaven Rd
- 57 Brookhaven Rd
- 78 Darnell Rd
- 34 Bonnybrook Rd
- 64 Brookhaven Rd
Your Personal Tour Guide
Ask me questions while you tour the home.