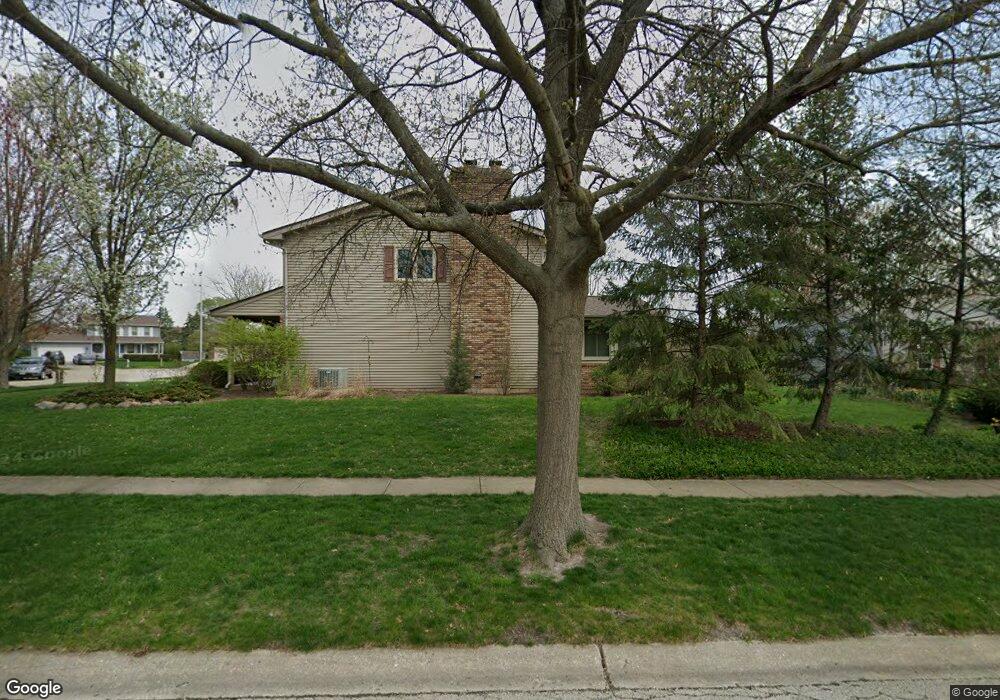
42 Crofton Rd Oswego, IL 60543
Boulder Hill NeighborhoodEstimated Value: $454,000 - $485,000
5
Beds
4
Baths
3,100
Sq Ft
$151/Sq Ft
Est. Value
About This Home
This home is located at 42 Crofton Rd, Oswego, IL 60543 and is currently estimated at $468,048, approximately $150 per square foot. 42 Crofton Rd is a home located in Kendall County with nearby schools including Old Post Elementary School, Thompson Jr. High School, and Oswego High School.
Ownership History
Date
Name
Owned For
Owner Type
Purchase Details
Closed on
Feb 27, 2020
Sold by
Mereness Kevin A and Mereness Elizabeth I
Bought by
Mcgann Taylor Joshua and Mcgann Taylor Samantha
Current Estimated Value
Home Financials for this Owner
Home Financials are based on the most recent Mortgage that was taken out on this home.
Original Mortgage
$270,000
Interest Rate
3.99%
Mortgage Type
New Conventional
Purchase Details
Closed on
Dec 29, 2000
Sold by
Fleetwood Thomas L and Fleetwood Kathleen
Bought by
Mereness Kevin A and Mereness Elizabeth I
Home Financials for this Owner
Home Financials are based on the most recent Mortgage that was taken out on this home.
Original Mortgage
$189,900
Interest Rate
7.58%
Purchase Details
Closed on
Mar 1, 1984
Create a Home Valuation Report for This Property
The Home Valuation Report is an in-depth analysis detailing your home's value as well as a comparison with similar homes in the area
Home Values in the Area
Average Home Value in this Area
Purchase History
| Date | Buyer | Sale Price | Title Company |
|---|---|---|---|
| Mcgann Taylor Joshua | $300,000 | First American Title | |
| Mereness Kevin A | $240,000 | First American Title Ins Co | |
| -- | $20,000 | -- |
Source: Public Records
Mortgage History
| Date | Status | Borrower | Loan Amount |
|---|---|---|---|
| Previous Owner | Mcgann Taylor Joshua | $270,000 | |
| Previous Owner | Mereness Kevin A | $189,900 |
Source: Public Records
Tax History Compared to Growth
Tax History
| Year | Tax Paid | Tax Assessment Tax Assessment Total Assessment is a certain percentage of the fair market value that is determined by local assessors to be the total taxable value of land and additions on the property. | Land | Improvement |
|---|---|---|---|---|
| 2024 | $9,847 | $128,362 | $23,322 | $105,040 |
| 2023 | $9,976 | $124,624 | $22,643 | $101,981 |
| 2022 | $9,976 | $116,471 | $21,162 | $95,309 |
| 2021 | $9,976 | $108,852 | $19,778 | $89,074 |
| 2020 | $9,323 | $104,665 | $19,017 | $85,648 |
| 2019 | $9,247 | $102,333 | $19,017 | $83,316 |
| 2018 | $8,994 | $98,763 | $17,353 | $81,410 |
| 2017 | $8,716 | $91,026 | $15,994 | $75,032 |
| 2016 | $8,062 | $83,510 | $14,673 | $68,837 |
| 2015 | $7,780 | $77,324 | $13,586 | $63,738 |
| 2014 | -- | $74,350 | $13,063 | $61,287 |
| 2013 | -- | $78,264 | $13,751 | $64,513 |
Source: Public Records
Map
Nearby Homes
- 10 Crofton Rd
- 420 Chesterfield Ct Unit 420
- 4 Circle Ct
- 22 Sherwick Rd
- 47 Old Post Rd
- 39 Cayman Dr
- 3 Orchard Rd
- 123 Orchard Rd
- 2 Orchard Rd
- 38 Ashlawn Ave
- 9 Cebold Dr
- 40 Codorus Rd
- 100 Piper Glen Ave
- 633 Henry Ln
- 621 Henry Ln
- 173 Piper Glen Ave
- 159 Piper Glen Ave
- 174 Piper Glen Ave
- 102 Piper Glen Ave
- 735 Alberta Ave