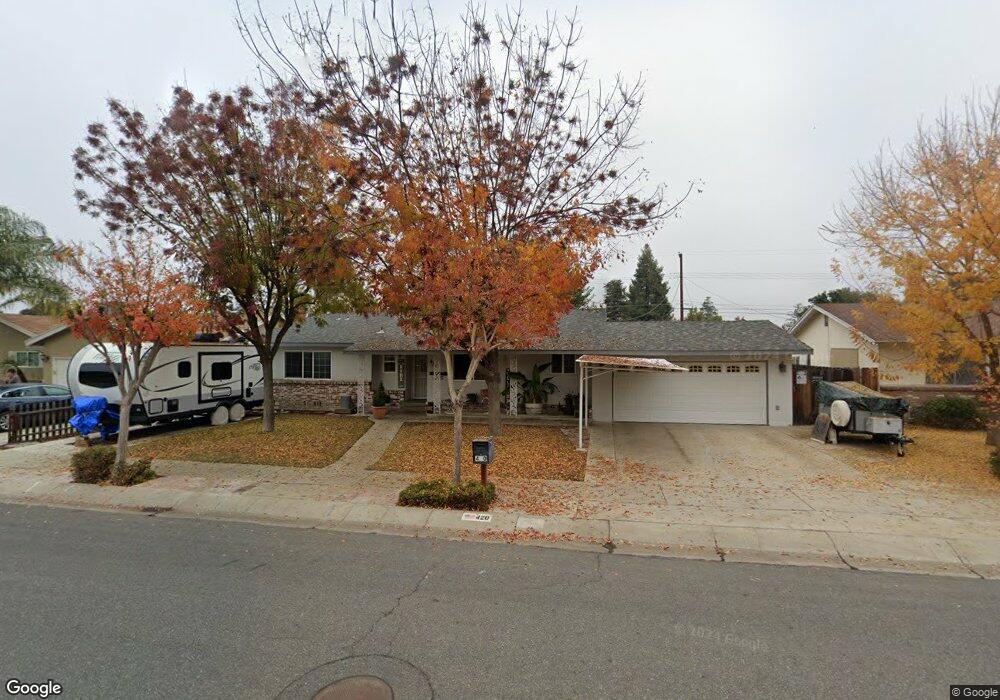
420 E Gail Ave Tulare, CA 93274
Northeast Tulare NeighborhoodEstimated Value: $335,000 - $362,000
3
Beds
3
Baths
1,609
Sq Ft
$218/Sq Ft
Est. Value
About This Home
This home is located at 420 E Gail Ave, Tulare, CA 93274 and is currently estimated at $350,040, approximately $217 per square foot. 420 E Gail Ave is a home located in Tulare County with nearby schools including Garden Elementary School, Cherry Avenue Middle School, and Tulare Western High School.
Ownership History
Date
Name
Owned For
Owner Type
Purchase Details
Closed on
Jun 30, 2025
Sold by
Mcroberts Doug
Bought by
Mcroberts Family Trust and Mcroberts
Current Estimated Value
Purchase Details
Closed on
Jun 7, 1996
Sold by
Hanson Duane M
Bought by
Mcroberts Doug and Mcroberts Kathy
Purchase Details
Closed on
Oct 19, 1995
Sold by
Beneficial California Inc
Bought by
Hanson Duane M and Hanson Marianne
Home Financials for this Owner
Home Financials are based on the most recent Mortgage that was taken out on this home.
Original Mortgage
$61,500
Interest Rate
7.59%
Purchase Details
Closed on
Sep 11, 1995
Sold by
Helt G Carl
Bought by
Beneficial California Inc
Home Financials for this Owner
Home Financials are based on the most recent Mortgage that was taken out on this home.
Original Mortgage
$61,500
Interest Rate
7.59%
Purchase Details
Closed on
Jun 20, 1995
Sold by
Lunde John W
Bought by
Helt G Carl and Helt Jane
Create a Home Valuation Report for This Property
The Home Valuation Report is an in-depth analysis detailing your home's value as well as a comparison with similar homes in the area
Home Values in the Area
Average Home Value in this Area
Purchase History
| Date | Buyer | Sale Price | Title Company |
|---|---|---|---|
| Mcroberts Family Trust | -- | None Listed On Document | |
| Mcroberts Doug | $10,500 | Chicago Title Co | |
| Hanson Duane M | $65,000 | -- | |
| Beneficial California Inc | -- | -- | |
| Helt G Carl | $22,240 | -- |
Source: Public Records
Mortgage History
| Date | Status | Borrower | Loan Amount |
|---|---|---|---|
| Previous Owner | Hanson Duane M | $61,500 |
Source: Public Records
Tax History
| Year | Tax Paid | Tax Assessment Tax Assessment Total Assessment is a certain percentage of the fair market value that is determined by local assessors to be the total taxable value of land and additions on the property. | Land | Improvement |
|---|---|---|---|---|
| 2025 | $1,297 | $126,257 | $53,160 | $73,097 |
| 2024 | $1,297 | $123,782 | $52,118 | $71,664 |
| 2023 | $1,262 | $121,356 | $51,097 | $70,259 |
| 2022 | $1,224 | $118,978 | $50,096 | $68,882 |
| 2021 | $1,207 | $116,645 | $49,114 | $67,531 |
| 2020 | $1,226 | $115,449 | $48,610 | $66,839 |
| 2019 | $1,255 | $113,185 | $47,657 | $65,528 |
| 2018 | $1,233 | $110,966 | $46,723 | $64,243 |
| 2017 | $1,220 | $108,790 | $45,807 | $62,983 |
| 2016 | $1,165 | $106,657 | $44,909 | $61,748 |
| 2015 | $1,123 | $105,054 | $44,234 | $60,820 |
| 2014 | $1,123 | $102,997 | $43,368 | $59,629 |
Source: Public Records
Map
Nearby Homes
- 445 E Chevy Chase Dr
- 479 E Sandra Ave
- 1922 N Adams St
- 1145 N M St
- 202 W Gail Ave
- 0 N Cherry St Unit 234531
- 1034 N Manor Dr
- 923 Lisbon Ave
- 939 Lisbon Ave
- 495 Congressional Ct
- 183 Oaks Ct
- 947 Lisbon Ave
- 273 E Gannon Dr
- 187 Mitchell Ave
- 1049 Madrid Ave
- 1110 Grove Dr
- 1842 Berlin Ct
- 384 Mitchell Ave
- 908 N Beatrice Dr
- 0 Cartmill Ave Ave Unit 121103
- 432 E Gail Ave
- 398 E Gail Ave
- 415 E Sandra Ave
- 448 E Gail Ave
- 397 E Sandra Ave
- 431 E Sandra Ave
- 415 E Gail Ave
- 383 E Sandra Ave
- 431 E Gail Ave
- 447 E Sandra Ave
- 397 E Gail Ave
- 468 E Gail Ave
- 447 E Gail Ave
- 383 E Gail Ave
- 463 E Sandra Ave
- 1820 N M St
- 463 E Gail Ave
- 1726 N M St
- 480 E Gail Ave
- 428 E Chevy Chase Dr
Your Personal Tour Guide
Ask me questions while you tour the home.