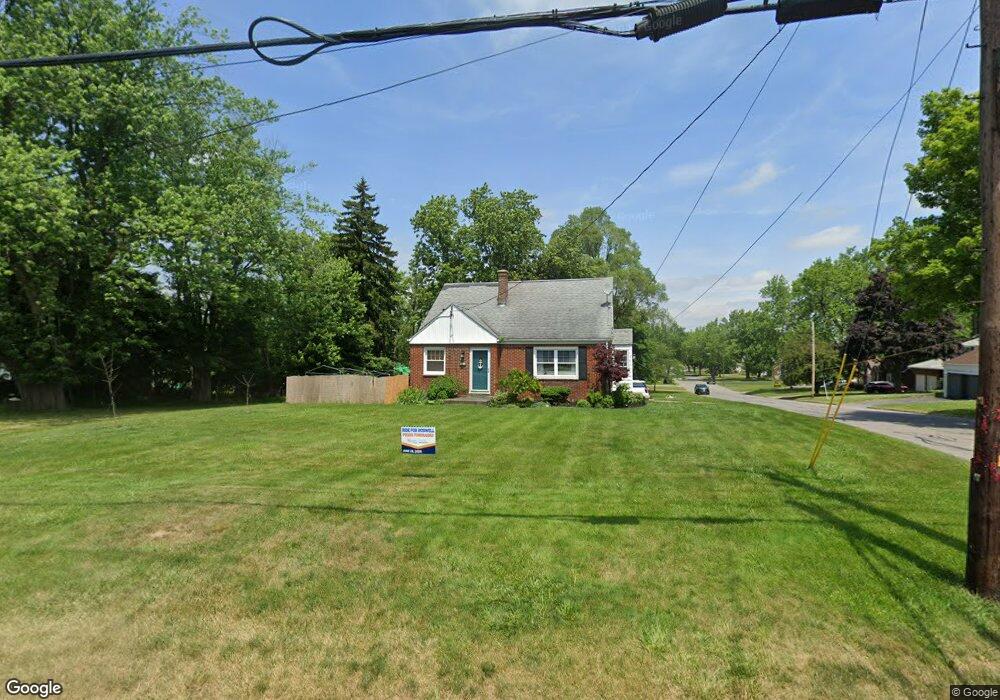
420 Main St West Seneca, NY 14224
Estimated Value: $257,887 - $308,000
3
Beds
1
Bath
2,000
Sq Ft
$142/Sq Ft
Est. Value
About This Home
This home is located at 420 Main St, West Seneca, NY 14224 and is currently estimated at $284,222, approximately $142 per square foot. 420 Main St is a home located in Erie County with nearby schools including West Elementary School, West Middle School, and West Seneca West Senior High School.
Ownership History
Date
Name
Owned For
Owner Type
Purchase Details
Closed on
Oct 8, 2009
Sold by
Steiner Robert E and Steiner Barbara L
Bought by
Pacholski Jennifer A
Current Estimated Value
Home Financials for this Owner
Home Financials are based on the most recent Mortgage that was taken out on this home.
Original Mortgage
$96,440
Outstanding Balance
$63,166
Interest Rate
5.14%
Mortgage Type
New Conventional
Estimated Equity
$221,056
Purchase Details
Closed on
Aug 12, 1997
Sold by
Sugg Mary J
Bought by
Steiner Ii Robert F and Steiner Barbara L
Create a Home Valuation Report for This Property
The Home Valuation Report is an in-depth analysis detailing your home's value as well as a comparison with similar homes in the area
Home Values in the Area
Average Home Value in this Area
Purchase History
| Date | Buyer | Sale Price | Title Company |
|---|---|---|---|
| Pacholski Jennifer A | $120,550 | Ticor Title Insurance Co | |
| Steiner Ii Robert F | $90,000 | -- |
Source: Public Records
Mortgage History
| Date | Status | Borrower | Loan Amount |
|---|---|---|---|
| Open | Pacholski Jennifer A | $96,440 |
Source: Public Records
Tax History Compared to Growth
Tax History
| Year | Tax Paid | Tax Assessment Tax Assessment Total Assessment is a certain percentage of the fair market value that is determined by local assessors to be the total taxable value of land and additions on the property. | Land | Improvement |
|---|---|---|---|---|
| 2024 | $5,064 | $50,900 | $5,800 | $45,100 |
| 2023 | $5,017 | $50,900 | $5,800 | $45,100 |
| 2022 | $4,882 | $50,900 | $5,800 | $45,100 |
| 2021 | $4,847 | $50,900 | $5,800 | $45,100 |
| 2020 | $4,309 | $50,900 | $5,800 | $45,100 |
| 2019 | $4,152 | $50,900 | $5,800 | $45,100 |
| 2018 | $4,124 | $50,900 | $5,800 | $45,100 |
| 2017 | $2,190 | $50,900 | $5,800 | $45,100 |
| 2016 | $3,898 | $50,900 | $5,800 | $45,100 |
| 2015 | -- | $50,900 | $5,800 | $45,100 |
| 2014 | -- | $50,900 | $5,800 | $45,100 |
Source: Public Records
Map
Nearby Homes