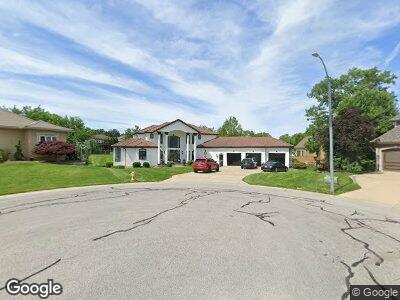
4200 NE Tremont Cir Lees Summit, MO 64064
Chapel Ridge NeighborhoodEstimated Value: $829,000 - $1,011,000
4
Beds
4
Baths
4,363
Sq Ft
$212/Sq Ft
Est. Value
About This Home
This home is located at 4200 NE Tremont Cir, Lees Summit, MO 64064 and is currently estimated at $925,983, approximately $212 per square foot. 4200 NE Tremont Cir is a home located in Jackson County with nearby schools including Chapel Lakes Elementary School, Delta Woods Middle School, and Blue Springs South High School.
Ownership History
Date
Name
Owned For
Owner Type
Purchase Details
Closed on
Oct 30, 2023
Sold by
Pixley Tara and Pixley Mark
Bought by
Dayton Brittany A
Current Estimated Value
Purchase Details
Closed on
May 2, 2008
Sold by
Dayton Michael A and Dayton Robin M
Bought by
Dayton Michael A and Dayton Robin M
Purchase Details
Closed on
Sep 30, 2005
Sold by
D C P D Dons Contracting & Property Deve
Bought by
Dayton Michael A and Dayton Robin M
Home Financials for this Owner
Home Financials are based on the most recent Mortgage that was taken out on this home.
Original Mortgage
$346,500
Interest Rate
5.73%
Mortgage Type
Fannie Mae Freddie Mac
Purchase Details
Closed on
Mar 29, 2004
Sold by
Longhorn Asset Management Ltd
Bought by
D C P D Dons Contracting & Proverty Deve
Create a Home Valuation Report for This Property
The Home Valuation Report is an in-depth analysis detailing your home's value as well as a comparison with similar homes in the area
Home Values in the Area
Average Home Value in this Area
Purchase History
| Date | Buyer | Sale Price | Title Company |
|---|---|---|---|
| Dayton Brittany A | -- | Continental Title Company | |
| Dayton Michael A | -- | Kansas City Title | |
| Dayton Michael A | -- | Kansas City Title | |
| D C P D Dons Contracting & Proverty Deve | -- | Kansas City Title |
Source: Public Records
Mortgage History
| Date | Status | Borrower | Loan Amount |
|---|---|---|---|
| Previous Owner | Dayton Michael A | $360,000 | |
| Previous Owner | Dayton Michael A | $329,500 | |
| Previous Owner | Dayton Michael A | $346,500 |
Source: Public Records
Tax History Compared to Growth
Tax History
| Year | Tax Paid | Tax Assessment Tax Assessment Total Assessment is a certain percentage of the fair market value that is determined by local assessors to be the total taxable value of land and additions on the property. | Land | Improvement |
|---|---|---|---|---|
| 2024 | $10,696 | $142,226 | $14,303 | $127,923 |
| 2023 | $10,696 | $142,226 | $11,164 | $131,062 |
| 2022 | $10,569 | $124,450 | $18,060 | $106,390 |
| 2021 | $10,559 | $124,450 | $18,060 | $106,390 |
| 2020 | $10,167 | $118,516 | $18,060 | $100,456 |
| 2019 | $9,855 | $118,516 | $18,060 | $100,456 |
| 2018 | $1,561,424 | $108,272 | $12,462 | $95,810 |
| 2017 | $9,281 | $108,272 | $12,462 | $95,810 |
| 2016 | $8,873 | $103,854 | $15,295 | $88,559 |
| 2014 | $8,599 | $100,016 | $14,288 | $85,728 |
Source: Public Records
Map
Nearby Homes
- 712 NE Plumbrook Place
- 4104 NE Edmonson Cir
- 4232 NE Tremont Ct
- 4121 NE Courtney Dr
- 826 NE Algonquin St Unit B
- 824 NE Algonquin St Unit A
- 793 NE Algonquin St Unit A
- 4027 NE Sagamore Dr Unit A
- 829 NE Algonquin St
- 604 NE Silverleaf Place
- 801 NE Lone Hill Dr
- 416 NE Brockton Dr
- 4709 NE Freehold Dr
- 529 NE Sienna Place
- 4004 NE Independence Ave
- 4813 NE Jamestown Dr
- 4134 NE Hampstead Dr
- 3717 NE Stanton St
- 4008 NE Apple Grove Dr
- 4004 NE Apple Grove Dr
- 4200 NE Tremont Cir
- 4201 NE Tremont Cir
- 4204 NE Tremont Cir
- 716 NE Ashmont Place
- 708 NE Dick Howser Ct
- 709 NE Ashmont Place
- 712 NE Ashmont Place
- 704 NE Dick Howser Ct
- 4104 NE Jacques Cir
- 712 NE Dick Howser Ct
- 4210 NE Edmonson Ct
- 708 NE Ashmont Place
- 4213 NE Tremont Cir
- 705 NE Ashmont Place
- 700 NE Dick Howser Ct
- 4216 NE Tremont Cir
- 4206 NE Edmonson Ct
- 713 NE Plumbrook Place
- 717 NE Plumbrook Place
- 701 NE Ashmont Place