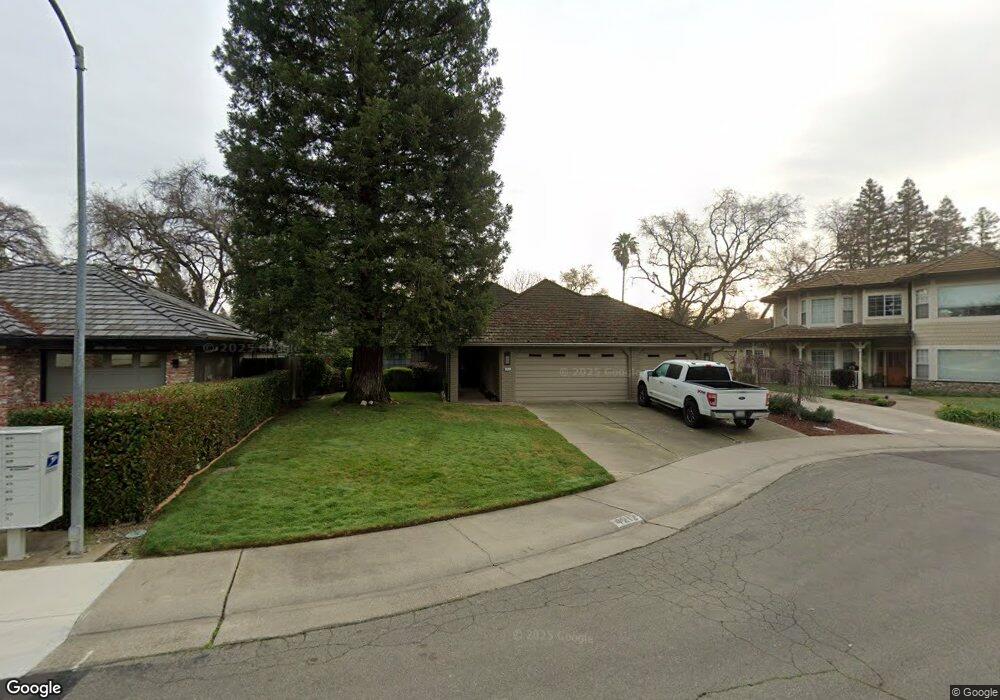
4212 Marl Way Carmichael, CA 95608
Estimated Value: $620,167 - $711,000
3
Beds
2
Baths
2,130
Sq Ft
$318/Sq Ft
Est. Value
About This Home
This home is located at 4212 Marl Way, Carmichael, CA 95608 and is currently estimated at $676,292, approximately $317 per square foot. 4212 Marl Way is a home located in Sacramento County with nearby schools including Thomas Kelly Elementary School, John Barrett Middle School, and Del Campo High School.
Ownership History
Date
Name
Owned For
Owner Type
Purchase Details
Closed on
Jun 16, 2015
Sold by
Starbuck Virgil G and Starbuck Victoria A
Bought by
Starbuck Virgil G and Starbuck Victoria A
Current Estimated Value
Home Financials for this Owner
Home Financials are based on the most recent Mortgage that was taken out on this home.
Original Mortgage
$325,000
Outstanding Balance
$252,259
Interest Rate
3.81%
Mortgage Type
New Conventional
Estimated Equity
$424,033
Purchase Details
Closed on
Sep 23, 2013
Sold by
Wiles Marjorie E and Round Dianne L
Bought by
Starbuck Gary and Starbuck Victoria
Home Financials for this Owner
Home Financials are based on the most recent Mortgage that was taken out on this home.
Original Mortgage
$320,000
Interest Rate
4.46%
Mortgage Type
Seller Take Back
Purchase Details
Closed on
May 7, 2004
Sold by
Wiles Marjorie E and Wiles Family Revocable Trust
Bought by
Wiles Marjorie E and Round Dianne L
Create a Home Valuation Report for This Property
The Home Valuation Report is an in-depth analysis detailing your home's value as well as a comparison with similar homes in the area
Home Values in the Area
Average Home Value in this Area
Purchase History
| Date | Buyer | Sale Price | Title Company |
|---|---|---|---|
| Starbuck Virgil G | -- | Stewart Title Of Sacramento | |
| Starbuck Gary | $340,000 | North American Title Company | |
| Wiles Marjorie E | -- | -- |
Source: Public Records
Mortgage History
| Date | Status | Borrower | Loan Amount |
|---|---|---|---|
| Open | Starbuck Virgil G | $325,000 | |
| Closed | Starbuck Gary | $320,000 |
Source: Public Records
Tax History
| Year | Tax Paid | Tax Assessment Tax Assessment Total Assessment is a certain percentage of the fair market value that is determined by local assessors to be the total taxable value of land and additions on the property. | Land | Improvement |
|---|---|---|---|---|
| 2025 | $4,956 | $416,783 | $91,934 | $324,849 |
| 2024 | $4,956 | $408,612 | $90,132 | $318,480 |
| 2023 | $4,878 | $400,601 | $88,365 | $312,236 |
| 2022 | $4,781 | $392,747 | $86,633 | $306,114 |
| 2021 | $4,702 | $385,047 | $84,935 | $300,112 |
| 2020 | $4,615 | $381,100 | $84,065 | $297,035 |
| 2019 | $4,522 | $373,628 | $82,417 | $291,211 |
| 2018 | $4,470 | $366,302 | $80,801 | $285,501 |
| 2017 | $4,427 | $359,120 | $79,217 | $279,903 |
| 2016 | $4,136 | $352,079 | $77,664 | $274,415 |
| 2015 | $4,110 | $346,792 | $76,498 | $270,294 |
| 2014 | $4,026 | $340,000 | $75,000 | $265,000 |
Source: Public Records
Map
Nearby Homes
- 6141 Lincoln Ave
- 4072 Alex Ln
- 6420 Quiescence Ln Unit C
- 3900 Park Circle Ln Unit B
- 4112 Alex Ln
- 3901 Park Circle Ln Unit B
- 8213 Caminata Ln
- 6395 Perrin Way
- 4097 Porton Ln
- 4093 Porton Ln
- 4015 Porton Ln
- 4089 Porton Ln
- 4019 Porton Ln
- 4085 Porton Ln
- 4023 Porton Ln
- 4076 Porton Ln
- 4027 Porton Ln
- 4072 Porton Ln
- 4434 Mapel Ln
- 6730 Lakeview Dr
Your Personal Tour Guide
Ask me questions while you tour the home.