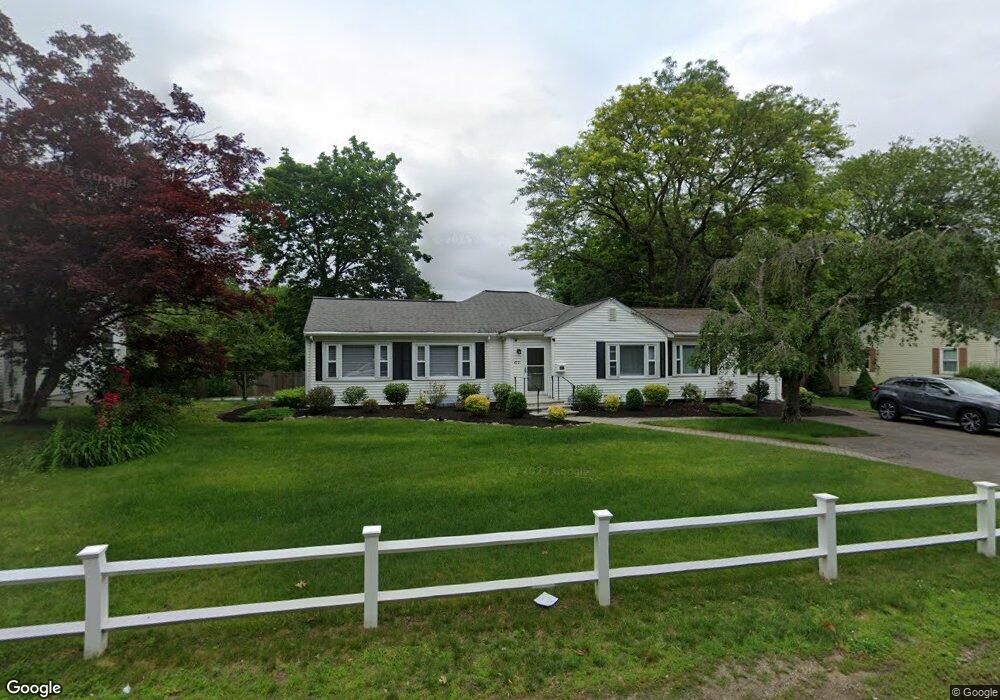
422 Bridge St Dedham, MA 02026
Riverdale NeighborhoodEstimated Value: $799,933 - $1,061,000
3
Beds
3
Baths
2,007
Sq Ft
$458/Sq Ft
Est. Value
About This Home
This home is located at 422 Bridge St, Dedham, MA 02026 and is currently estimated at $919,983, approximately $458 per square foot. 422 Bridge St is a home located in Norfolk County with nearby schools including Riverdale Elementary School, Dedham Middle School, and Dedham High School.
Ownership History
Date
Name
Owned For
Owner Type
Purchase Details
Closed on
Nov 27, 2024
Sold by
Simpson Robert W and Simpson Seconda L
Bought by
Simpson Ft and Simpson
Current Estimated Value
Purchase Details
Closed on
Jul 25, 1972
Bought by
Simpson Robert W and Simpson Seconda L
Create a Home Valuation Report for This Property
The Home Valuation Report is an in-depth analysis detailing your home's value as well as a comparison with similar homes in the area
Home Values in the Area
Average Home Value in this Area
Purchase History
| Date | Buyer | Sale Price | Title Company |
|---|---|---|---|
| Simpson Ft | -- | None Available | |
| Simpson Ft | -- | None Available | |
| Simpson Robert W | -- | -- |
Source: Public Records
Mortgage History
| Date | Status | Borrower | Loan Amount |
|---|---|---|---|
| Previous Owner | Simpson Robert W | $90,000 |
Source: Public Records
Tax History
| Year | Tax Paid | Tax Assessment Tax Assessment Total Assessment is a certain percentage of the fair market value that is determined by local assessors to be the total taxable value of land and additions on the property. | Land | Improvement |
|---|---|---|---|---|
| 2025 | $8,169 | $647,300 | $281,600 | $365,700 |
| 2024 | $8,036 | $642,900 | $266,700 | $376,200 |
| 2023 | $7,535 | $586,800 | $236,800 | $350,000 |
| 2022 | $7,170 | $537,100 | $231,800 | $305,300 |
| 2021 | $6,972 | $510,000 | $226,800 | $283,200 |
| 2020 | $6,780 | $494,200 | $216,800 | $277,400 |
| 2019 | $6,583 | $465,200 | $188,600 | $276,600 |
| 2018 | $6,159 | $423,300 | $166,600 | $256,700 |
| 2017 | $6,091 | $412,700 | $156,000 | $256,700 |
| 2016 | $6,145 | $396,700 | $136,200 | $260,500 |
| 2015 | $5,758 | $362,800 | $133,500 | $229,300 |
| 2014 | $5,424 | $337,300 | $130,500 | $206,800 |
Source: Public Records
Map
Nearby Homes
- 27 Pine St
- 75 Bingham Ave
- 570 Bridge St
- 147 Pine St
- 92 Old River Place
- 45 Commonwealth Ave
- 47 Village Ave Unit 203
- 56 Riverview St
- 47 Bemis Rd
- 55 Church St Unit 1
- 44 Court St
- 46 Church St
- 42 Churchill Place
- 1515 Vfw Pkwy Unit M19
- 8 Sumner St
- 441 Washington St Unit 301
- 441 Washington St Unit 302
- 63 Dixon Ave
- 41 Vogel St
- 442 High St
Your Personal Tour Guide
Ask me questions while you tour the home.