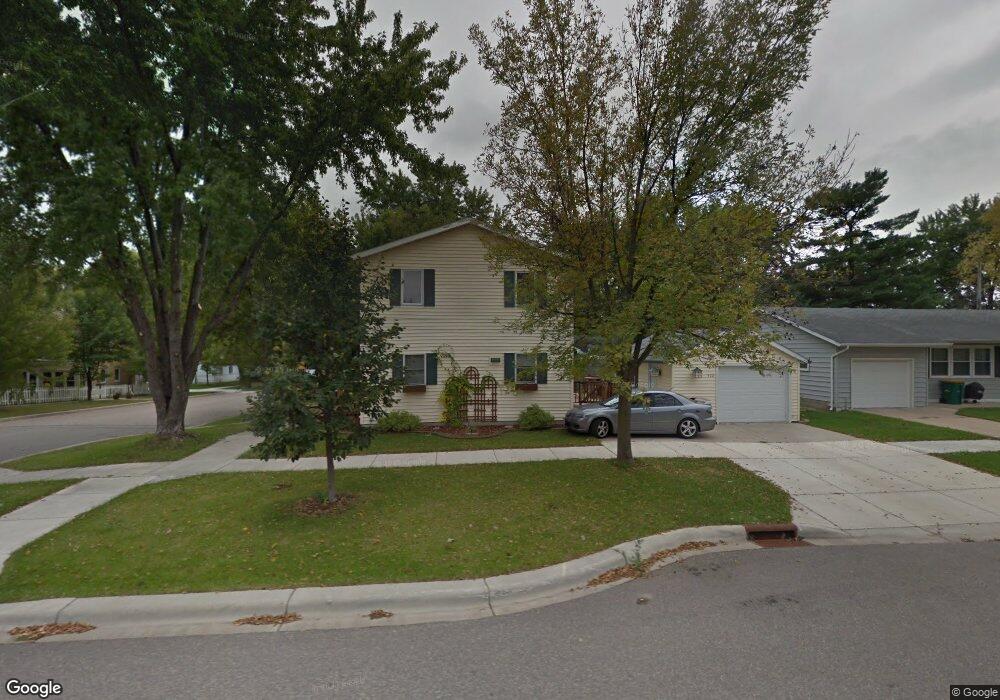
422 E 2nd St Chaska, MN 55318
Estimated Value: $310,000 - $329,000
3
Beds
3
Baths
1,536
Sq Ft
$208/Sq Ft
Est. Value
About This Home
This home is located at 422 E 2nd St, Chaska, MN 55318 and is currently estimated at $319,056, approximately $207 per square foot. 422 E 2nd St is a home located in Carver County with nearby schools including Victoria Elementary School, Chaska Middle School East, and Chaska High School.
Ownership History
Date
Name
Owned For
Owner Type
Purchase Details
Closed on
Jun 18, 2018
Sold by
Leitch Jacob P and Leitch Kelly
Bought by
Westplate Justin Myron
Current Estimated Value
Home Financials for this Owner
Home Financials are based on the most recent Mortgage that was taken out on this home.
Original Mortgage
$212,420
Outstanding Balance
$184,119
Interest Rate
4.6%
Mortgage Type
New Conventional
Estimated Equity
$134,937
Purchase Details
Closed on
Jun 19, 2012
Sold by
Secretary Of Veterans Affairs
Bought by
Leitch Jacob P
Home Financials for this Owner
Home Financials are based on the most recent Mortgage that was taken out on this home.
Original Mortgage
$132,269
Interest Rate
3.48%
Mortgage Type
New Conventional
Purchase Details
Closed on
Aug 31, 2001
Sold by
Nutter William R and Nutter Darla J
Bought by
Huber James F and Huber Barbara Ann
Purchase Details
Closed on
Jan 9, 1998
Sold by
Gnade Mabel Martha
Bought by
Nutter William R and Nutter Darla J
Create a Home Valuation Report for This Property
The Home Valuation Report is an in-depth analysis detailing your home's value as well as a comparison with similar homes in the area
Home Values in the Area
Average Home Value in this Area
Purchase History
| Date | Buyer | Sale Price | Title Company |
|---|---|---|---|
| Westplate Justin Myron | $223,600 | Burnet Title | |
| Leitch Jacob P | -- | Eagle Creek Title | |
| Huber James F | $167,000 | -- | |
| Nutter William R | $59,900 | -- |
Source: Public Records
Mortgage History
| Date | Status | Borrower | Loan Amount |
|---|---|---|---|
| Open | Westplate Justin Myron | $212,420 | |
| Previous Owner | Leitch Jacob P | $132,269 |
Source: Public Records
Tax History
| Year | Tax Paid | Tax Assessment Tax Assessment Total Assessment is a certain percentage of the fair market value that is determined by local assessors to be the total taxable value of land and additions on the property. | Land | Improvement |
|---|---|---|---|---|
| 2025 | $3,226 | $295,300 | $100,000 | $195,300 |
| 2024 | $3,074 | $285,300 | $90,000 | $195,300 |
| 2023 | $3,130 | $271,900 | $90,000 | $181,900 |
| 2022 | $2,572 | $287,500 | $57,000 | $230,500 |
| 2021 | $2,400 | $212,700 | $47,400 | $165,300 |
| 2020 | $2,388 | $210,200 | $47,400 | $162,800 |
| 2019 | $2,314 | $196,100 | $45,100 | $151,000 |
| 2018 | $2,890 | $196,100 | $45,100 | $151,000 |
| 2017 | $2,884 | $183,700 | $38,100 | $145,600 |
| 2016 | $3,186 | $178,100 | $0 | $0 |
| 2015 | $3,076 | $166,400 | $0 | $0 |
| 2014 | $3,076 | $162,500 | $0 | $0 |
Source: Public Records
Map
Nearby Homes
- 215 N Maple St
- 217 Beech St
- 213 N Walnut St
- 217 N Walnut St
- 215 N Walnut St
- 504 N Maple St
- 307 W 5th St
- 954 Conner St
- 952 Conner St
- 388 Brickyard Dr
- 1109 Crystal Ct
- 1427 Ravoux Ln
- 705 Ensconced Way
- 1242 Crystal Place E
- 260 Liberty Heights Dr
- 734 Ensconced Way
- 707 Ensconced Way
- 719 Ensconced Way
- 749 Ensconced Way
- 738 Ensconced Way
Your Personal Tour Guide
Ask me questions while you tour the home.