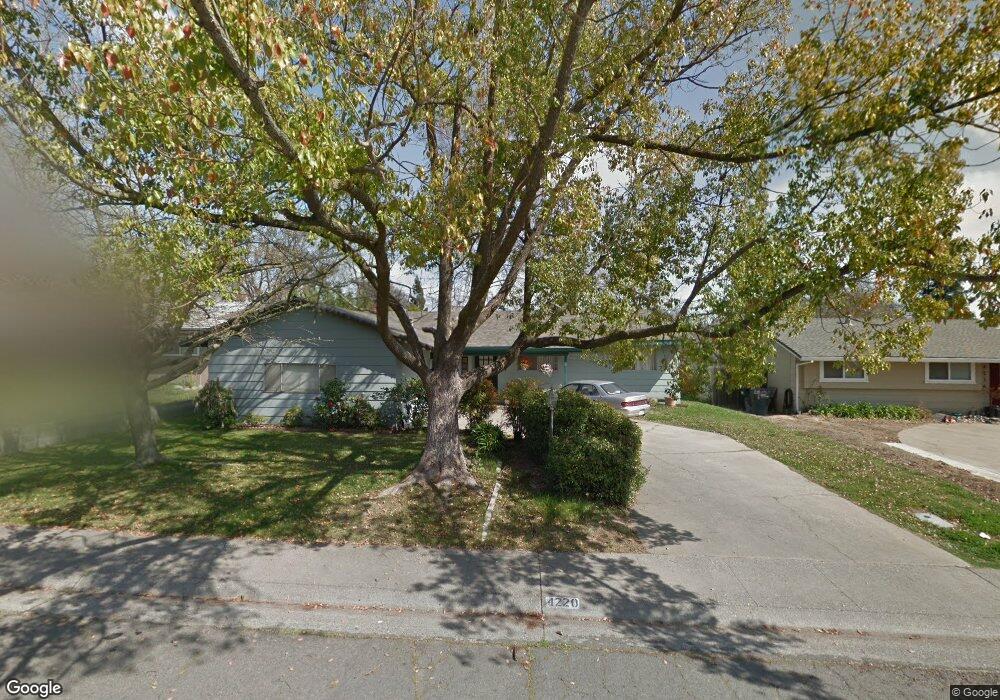
4220 Lingrove Way Carmichael, CA 95608
Estimated Value: $434,000 - $501,000
3
Beds
2
Baths
1,274
Sq Ft
$375/Sq Ft
Est. Value
About This Home
This home is located at 4220 Lingrove Way, Carmichael, CA 95608 and is currently estimated at $477,552, approximately $374 per square foot. 4220 Lingrove Way is a home located in Sacramento County with nearby schools including Albert Schweitzer Elementary School, John Barrett Middle School, and Del Campo High School.
Ownership History
Date
Name
Owned For
Owner Type
Purchase Details
Closed on
Jan 24, 2018
Sold by
Bryan David G and David G Bryan Trust
Bought by
Pesely Kyle and Powell William
Current Estimated Value
Home Financials for this Owner
Home Financials are based on the most recent Mortgage that was taken out on this home.
Original Mortgage
$248,000
Outstanding Balance
$209,283
Interest Rate
3.94%
Mortgage Type
New Conventional
Estimated Equity
$268,269
Purchase Details
Closed on
Dec 28, 2017
Sold by
Masuda Kelly Miyoko
Bought by
Pesely Kyle
Home Financials for this Owner
Home Financials are based on the most recent Mortgage that was taken out on this home.
Original Mortgage
$248,000
Outstanding Balance
$209,283
Interest Rate
3.94%
Mortgage Type
New Conventional
Estimated Equity
$268,269
Purchase Details
Closed on
Oct 19, 2011
Sold by
Bryan David G
Bought by
Bryan David G and David G Bryan Trust
Create a Home Valuation Report for This Property
The Home Valuation Report is an in-depth analysis detailing your home's value as well as a comparison with similar homes in the area
Home Values in the Area
Average Home Value in this Area
Purchase History
We collect this data history from publicly available records. To have your information removed, we recommend requesting removal directly through your county’s website.
| Date | Buyer | Sale Price | Title Company |
|---|---|---|---|
| Pesely Kyle | $310,000 | Placer Title Company | |
| Pesely Kyle | -- | Placer Title Company | |
| Bryan David G | -- | None Available |
Source: Public Records
Mortgage History
We collect this data history from publicly available records. To have your information removed, we recommend requesting removal directly through your county’s website.
| Date | Status | Borrower | Loan Amount |
|---|---|---|---|
| Open | Pesely Kyle | $248,000 |
Source: Public Records
Tax History
| Year | Tax Paid | Tax Assessment Tax Assessment Total Assessment is a certain percentage of the fair market value that is determined by local assessors to be the total taxable value of land and additions on the property. | Land | Improvement |
|---|---|---|---|---|
| 2025 | $4,274 | $352,723 | $113,781 | $238,942 |
| 2024 | $4,184 | $345,807 | $111,550 | $234,257 |
| 2023 | $4,117 | $339,027 | $109,363 | $229,664 |
| 2022 | $4,035 | $332,380 | $107,219 | $225,161 |
| 2021 | $3,969 | $325,864 | $105,117 | $220,747 |
| 2020 | $3,895 | $322,524 | $104,040 | $218,484 |
| 2019 | $3,816 | $316,200 | $102,000 | $214,200 |
| 2018 | $745 | $60,325 | $13,275 | $47,050 |
| 2017 | $738 | $59,143 | $13,015 | $46,128 |
| 2016 | $690 | $57,984 | $12,760 | $45,224 |
| 2015 | $723 | $57,114 | $12,569 | $44,545 |
| 2014 | $710 | $56,005 | $12,329 | $43,676 |
Source: Public Records
Map
Nearby Homes
- 4129 Poppleton Way
- 4130 Prospect Dr
- 8432 Gaylor Way
- 4243 Glenridge Dr
- 4073 Porton Ln
- 4077 Porton Ln
- 4043 Porton Ln
- 4081 Porton Ln
- 4039 Porton Ln
- 4085 Porton Ln
- 4035 Porton Ln
- 4031 Porton Ln
- 4089 Porton Ln
- 4044 Porton Ln
- 4093 Porton Ln
- 4027 Porton Ln
- 4023 Porton Ln
- 4097 Porton Ln
- 4019 Porton Ln
- 4015 Porton Ln
- 4212 Lingrove Way
- 4208 Lingrove Way
- 4216 Lingrove Way
- 6840 Goot Way
- 4204 Lingrove Way
- 6844 Goot Way
- 6852 Goot Way
- 6839 Goot Way
- 4209 Lingrove Way
- 4211 Lingrove Way
- 6848 Goot Way
- 4224 Lingrove Way
- 6856 Goot Way
- 4221 Lingrove Way
- 6825 Lincoln Ave
- 4205 Lingrove Way
- 6821 Lincoln Ave
- 6851 Goot Way
- 6833 Lincoln Ave
- 4225 Lingrove Way
Your Personal Tour Guide
Ask me questions while you tour the home.