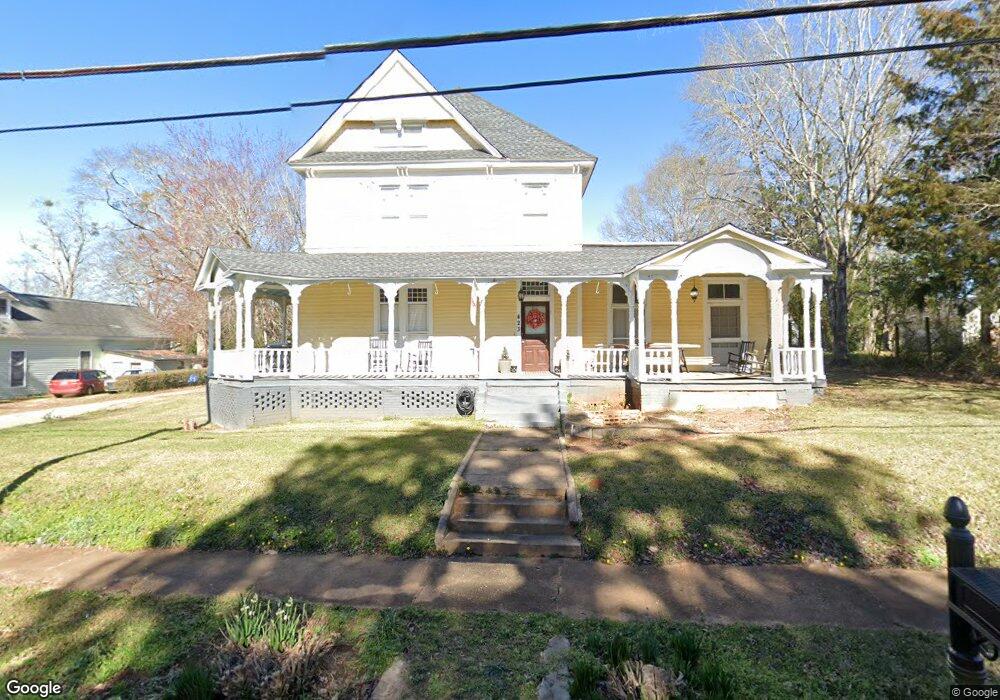
423 Elm St Barnesville, GA 30204
Estimated Value: $325,027 - $520,000
5
Beds
3
Baths
3,680
Sq Ft
$110/Sq Ft
Est. Value
About This Home
This home is located at 423 Elm St, Barnesville, GA 30204 and is currently estimated at $404,007, approximately $109 per square foot. 423 Elm St is a home located in Lamar County with nearby schools including Lamar County Primary School, Lamar County Elementary School, and Lamar County Middle School.
Ownership History
Date
Name
Owned For
Owner Type
Purchase Details
Closed on
Jan 16, 2020
Sold by
Blanton Terry H
Bought by
Buice Katherine Ware and Buice Michael Jarad
Current Estimated Value
Home Financials for this Owner
Home Financials are based on the most recent Mortgage that was taken out on this home.
Original Mortgage
$227,950
Outstanding Balance
$200,935
Interest Rate
3.7%
Mortgage Type
New Conventional
Estimated Equity
$203,072
Purchase Details
Closed on
Jan 5, 2018
Sold by
Smith Richard Madison
Bought by
Blanton Terry H
Purchase Details
Closed on
Jul 11, 2017
Sold by
Smith Lisa Wynn Ellis
Bought by
Smith Richard Madison
Purchase Details
Closed on
Apr 30, 2004
Sold by
Smith Richard
Bought by
Smith Richard and Smith Lisa
Purchase Details
Closed on
Sep 4, 1994
Bought by
Smith Richard
Create a Home Valuation Report for This Property
The Home Valuation Report is an in-depth analysis detailing your home's value as well as a comparison with similar homes in the area
Home Values in the Area
Average Home Value in this Area
Purchase History
| Date | Buyer | Sale Price | Title Company |
|---|---|---|---|
| Buice Katherine Ware | $235,000 | -- | |
| Blanton Terry H | $100,000 | -- | |
| Smith Richard Madison | -- | -- | |
| Smith Richard | -- | -- | |
| Smith Richard | -- | -- |
Source: Public Records
Mortgage History
| Date | Status | Borrower | Loan Amount |
|---|---|---|---|
| Open | Buice Katherine Ware | $227,950 |
Source: Public Records
Tax History
| Year | Tax Paid | Tax Assessment Tax Assessment Total Assessment is a certain percentage of the fair market value that is determined by local assessors to be the total taxable value of land and additions on the property. | Land | Improvement |
|---|---|---|---|---|
| 2025 | $2,435 | $123,006 | $4,800 | $118,206 |
| 2024 | $3,276 | $115,996 | $4,000 | $111,996 |
| 2023 | $3,593 | $118,070 | $4,000 | $114,070 |
| 2022 | $3,085 | $111,738 | $4,000 | $107,738 |
| 2021 | $2,620 | $87,142 | $4,000 | $83,142 |
| 2020 | $2,603 | $82,236 | $4,000 | $78,236 |
| 2019 | $1,997 | $62,918 | $4,000 | $58,918 |
| 2018 | $1,713 | $56,211 | $4,000 | $52,211 |
| 2017 | $1,497 | $56,211 | $4,000 | $52,211 |
| 2016 | $1,493 | $56,211 | $4,000 | $52,211 |
| 2015 | $1,492 | $56,211 | $4,000 | $52,211 |
| 2014 | $1,441 | $56,211 | $4,000 | $52,211 |
| 2013 | -- | $57,237 | $5,026 | $52,210 |
Source: Public Records
Map
Nearby Homes
- 149 Akins St
- 531 Thomaston St
- 642 Greenwood St
- 407 Westchester Dr
- 339 Atlanta St
- 114 Stafford Ave
- 13 Brown St
- 275 Rose Ave
- 147 Stafford Ave
- 149 Holmes St
- 121 Westchester Dr
- 7 Jackson St
- 109 Barnesville Ave
- 107 1st St
- 0 Washington St Unit 10710879
- 163 Grove St
- 178 Barnesville Ave
- 250 Mill St
- 24 Sims St
- 0 Highway 341 S Unit 181569
Your Personal Tour Guide
Ask me questions while you tour the home.