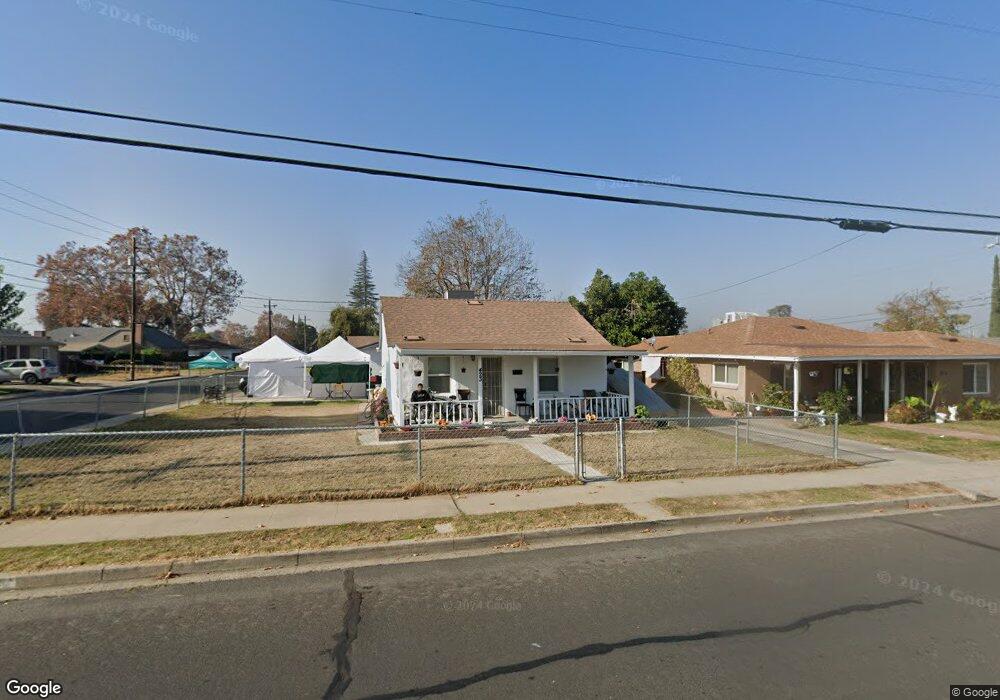
423 Locust Ave Manteca, CA 95337
Downtown Manteca NeighborhoodEstimated Value: $457,356 - $581,000
4
Beds
2
Baths
1,729
Sq Ft
$303/Sq Ft
Est. Value
About This Home
This home is located at 423 Locust Ave, Manteca, CA 95337 and is currently estimated at $523,589, approximately $302 per square foot. 423 Locust Ave is a home located in San Joaquin County with nearby schools including Sequoia Elementary School, Manteca High School, and St. Anthony's Catholic School.
Ownership History
Date
Name
Owned For
Owner Type
Purchase Details
Closed on
Sep 20, 2002
Sold by
Salas Johnnie N and Salas Annie R
Bought by
Abreu John
Current Estimated Value
Home Financials for this Owner
Home Financials are based on the most recent Mortgage that was taken out on this home.
Original Mortgage
$216,600
Outstanding Balance
$89,953
Interest Rate
6.16%
Estimated Equity
$433,636
Purchase Details
Closed on
Aug 10, 2000
Sold by
Brocchini Marvin D and The Marvin & Barbara Brocchini
Bought by
Salas Johnnie N and Salas Annie R
Home Financials for this Owner
Home Financials are based on the most recent Mortgage that was taken out on this home.
Original Mortgage
$142,500
Interest Rate
8.16%
Purchase Details
Closed on
Dec 10, 1999
Sold by
Brocchini Marvin D and Brocchini Barbara J
Bought by
Brocchini Marvin D and Brocchini Barbara J
Create a Home Valuation Report for This Property
The Home Valuation Report is an in-depth analysis detailing your home's value as well as a comparison with similar homes in the area
Home Values in the Area
Average Home Value in this Area
Purchase History
| Date | Buyer | Sale Price | Title Company |
|---|---|---|---|
| Abreu John | $228,000 | Alliance Title Company | |
| Salas Johnnie N | $150,000 | Alliance Title Company | |
| Salas Johnnie N | $150,000 | Alliance Title Company | |
| Brocchini Marvin D | -- | -- | |
| Brocchini Marvin D | -- | -- |
Source: Public Records
Mortgage History
| Date | Status | Borrower | Loan Amount |
|---|---|---|---|
| Open | Abreu John | $216,600 | |
| Previous Owner | Salas Johnnie N | $142,500 |
Source: Public Records
Tax History
| Year | Tax Paid | Tax Assessment Tax Assessment Total Assessment is a certain percentage of the fair market value that is determined by local assessors to be the total taxable value of land and additions on the property. | Land | Improvement |
|---|---|---|---|---|
| 2025 | $3,692 | $330,195 | $94,133 | $236,062 |
| 2024 | $3,588 | $323,722 | $92,288 | $231,434 |
| 2023 | $3,545 | $317,376 | $90,479 | $226,897 |
| 2022 | $3,492 | $311,154 | $88,705 | $222,449 |
| 2021 | $3,454 | $305,054 | $86,966 | $218,088 |
| 2020 | $3,315 | $301,927 | $86,075 | $215,852 |
| 2019 | $3,272 | $296,008 | $84,388 | $211,620 |
| 2018 | $3,229 | $290,205 | $82,734 | $207,471 |
| 2017 | $3,182 | $284,515 | $81,112 | $203,403 |
| 2016 | $2,510 | $225,000 | $65,000 | $160,000 |
| 2014 | $1,616 | $180,000 | $45,000 | $135,000 |
Source: Public Records
Map
Nearby Homes
- 1015 Tenaya Ct
- 865 Locust Ave
- 119 Almond Ave
- 802 W Center St
- 776 Folsom Way
- 1164 Marion St
- 1142 Mammoth Dr
- 896 Cinnamon Teal Ct
- 578 Schooner Place
- 707 Chenin Blanc Dr
- 1023 Camphor St
- 123 Wawona St
- 765 Jackolyn Dr
- 1432 Driftwood Way
- 938 Snowgoose Ln
- 290 Victory Ave
- 414 Cherry Ln Unit G
- 778 Mission Ridge Dr
- 412 Golf Cir E Unit E
- 628 Mission Ridge Dr
Your Personal Tour Guide
Ask me questions while you tour the home.