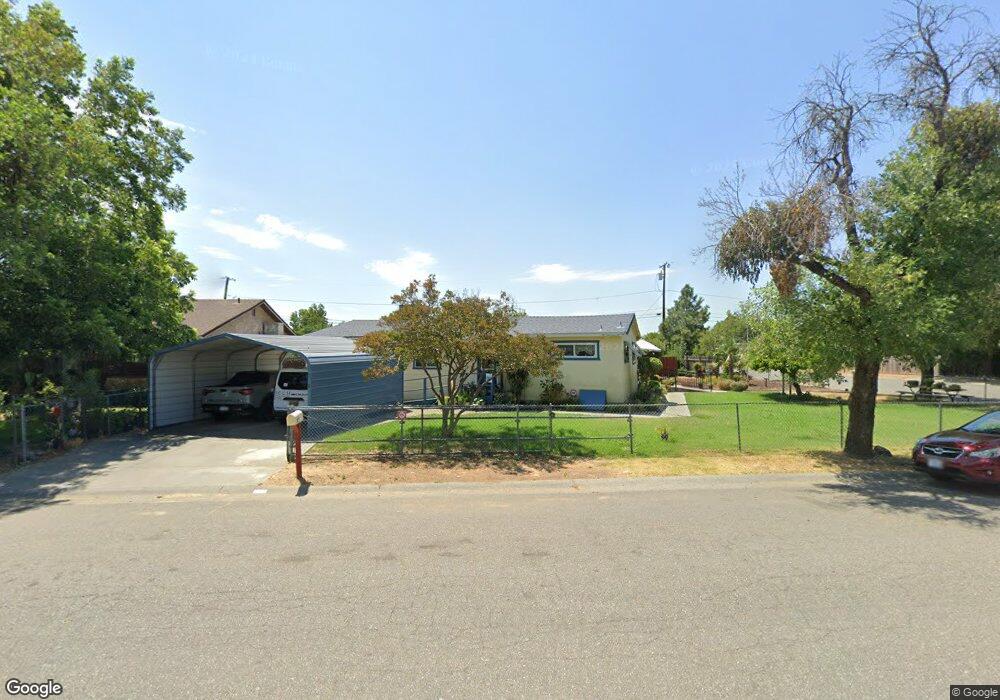
423 Walnut St Corning, CA 96021
Estimated Value: $390,000 - $589,000
7
Beds
2
Baths
3,156
Sq Ft
$156/Sq Ft
Est. Value
About This Home
This home is located at 423 Walnut St, Corning, CA 96021 and is currently estimated at $491,471, approximately $155 per square foot. 423 Walnut St is a home located in Tehama County with nearby schools including Olive View Elementary School, Maywood Middle School, and Corning High School.
Ownership History
Date
Name
Owned For
Owner Type
Purchase Details
Closed on
May 6, 2020
Sold by
Heaney Jeff and Heaney Elena
Bought by
Mendros Erico and Mendros Marites
Current Estimated Value
Home Financials for this Owner
Home Financials are based on the most recent Mortgage that was taken out on this home.
Original Mortgage
$360,000
Outstanding Balance
$320,199
Interest Rate
3.5%
Mortgage Type
Seller Take Back
Estimated Equity
$171,272
Purchase Details
Closed on
Jan 22, 2001
Sold by
Crosby Catherine G
Bought by
Christians Rudolf
Home Financials for this Owner
Home Financials are based on the most recent Mortgage that was taken out on this home.
Original Mortgage
$75,000
Interest Rate
7.13%
Mortgage Type
Seller Take Back
Create a Home Valuation Report for This Property
The Home Valuation Report is an in-depth analysis detailing your home's value as well as a comparison with similar homes in the area
Purchase History
| Date | Buyer | Sale Price | Title Company |
|---|---|---|---|
| Mendros Erico | $360,000 | Northern California Title Co | |
| Christians Rudolf | $100,000 | Chicago Title Co |
Source: Public Records
Mortgage History
| Date | Status | Borrower | Loan Amount |
|---|---|---|---|
| Open | Mendros Erico | $360,000 | |
| Previous Owner | Christians Rudolf | $75,000 |
Source: Public Records
Tax History
| Year | Tax Paid | Tax Assessment Tax Assessment Total Assessment is a certain percentage of the fair market value that is determined by local assessors to be the total taxable value of land and additions on the property. | Land | Improvement |
|---|---|---|---|---|
| 2025 | $4,327 | $426,709 | $65,616 | $361,093 |
| 2023 | $4,219 | $408,422 | $63,069 | $345,353 |
| 2022 | $4,081 | $393,003 | $61,833 | $331,170 |
| 2021 | $3,931 | $385,729 | $60,621 | $325,108 |
| 2020 | $1,906 | $179,485 | $29,191 | $150,294 |
| 2019 | $1,831 | $176,254 | $28,619 | $147,635 |
| 2018 | $1,837 | $173,081 | $28,058 | $145,023 |
| 2017 | $1,815 | $168,774 | $27,508 | $141,266 |
| 2016 | $1,668 | $163,103 | $26,969 | $136,134 |
| 2015 | -- | $160,654 | $26,564 | $134,090 |
| 2014 | $1,629 | $157,508 | $26,044 | $131,464 |
Source: Public Records
Map
Nearby Homes
Your Personal Tour Guide
Ask me questions while you tour the home.