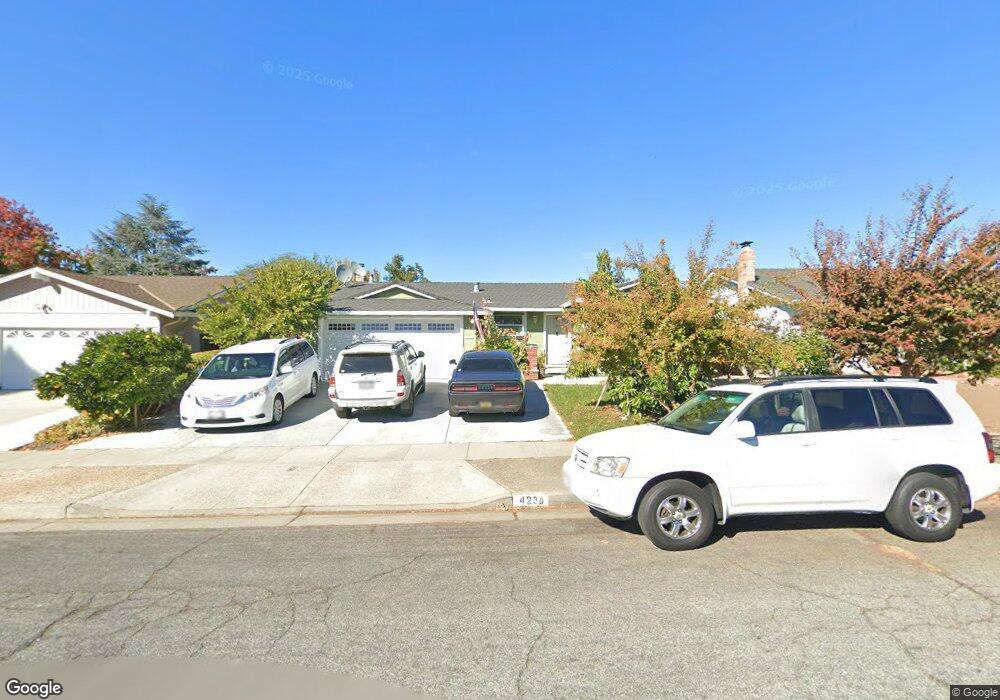
4234 Mountcastle Way San Jose, CA 95136
Blossom Valley NeighborhoodEstimated Value: $1,517,000 - $1,711,000
4
Beds
2
Baths
1,483
Sq Ft
$1,097/Sq Ft
Est. Value
About This Home
This home is located at 4234 Mountcastle Way, San Jose, CA 95136 and is currently estimated at $1,626,893, approximately $1,097 per square foot. 4234 Mountcastle Way is a home located in Santa Clara County with nearby schools including Terrell Elementary School, John Muir Middle School, and Gunderson High School.
Ownership History
Date
Name
Owned For
Owner Type
Purchase Details
Closed on
Jun 29, 2012
Sold by
Prado Lucio Francisco and Velasquez Laura
Bought by
Prado Lucio Francisco
Current Estimated Value
Purchase Details
Closed on
Oct 13, 2003
Sold by
Angelucci Perry R and Angelucci Stephanie
Bought by
Prado Lucio F and Velasquez Laura
Home Financials for this Owner
Home Financials are based on the most recent Mortgage that was taken out on this home.
Original Mortgage
$428,000
Outstanding Balance
$196,573
Interest Rate
5.98%
Mortgage Type
Stand Alone First
Estimated Equity
$1,430,320
Purchase Details
Closed on
May 4, 1998
Sold by
Angelucci Perry R and Ralph Perry
Bought by
Angelucci Perry R and Angelucci Stephanie
Home Financials for this Owner
Home Financials are based on the most recent Mortgage that was taken out on this home.
Original Mortgage
$180,000
Interest Rate
7.05%
Create a Home Valuation Report for This Property
The Home Valuation Report is an in-depth analysis detailing your home's value as well as a comparison with similar homes in the area
Home Values in the Area
Average Home Value in this Area
Purchase History
| Date | Buyer | Sale Price | Title Company |
|---|---|---|---|
| Prado Lucio Francisco | -- | None Available | |
| Prado Lucio F | $535,000 | Chicago Title | |
| Angelucci Perry R | -- | First American Title Guarant |
Source: Public Records
Mortgage History
| Date | Status | Borrower | Loan Amount |
|---|---|---|---|
| Open | Prado Lucio F | $428,000 | |
| Previous Owner | Angelucci Perry R | $180,000 |
Source: Public Records
Tax History Compared to Growth
Tax History
| Year | Tax Paid | Tax Assessment Tax Assessment Total Assessment is a certain percentage of the fair market value that is determined by local assessors to be the total taxable value of land and additions on the property. | Land | Improvement |
|---|---|---|---|---|
| 2025 | $11,481 | $814,823 | $462,073 | $352,750 |
| 2024 | $11,481 | $798,847 | $453,013 | $345,834 |
| 2023 | $11,241 | $783,184 | $444,131 | $339,053 |
| 2022 | $11,115 | $767,828 | $435,423 | $332,405 |
| 2021 | $10,229 | $752,774 | $426,886 | $325,888 |
| 2020 | $9,990 | $745,056 | $422,509 | $322,547 |
| 2019 | $9,773 | $730,448 | $414,225 | $316,223 |
| 2018 | $9,673 | $716,126 | $406,103 | $310,023 |
| 2017 | $9,593 | $702,086 | $398,141 | $303,945 |
| 2016 | $9,414 | $688,321 | $390,335 | $297,986 |
| 2015 | $9,350 | $677,982 | $384,472 | $293,510 |
| 2014 | $8,898 | $664,702 | $376,941 | $287,761 |
Source: Public Records
Map
Nearby Homes
- 883 Calle de Verde
- 4581 Shadowhurst Ct
- 4586 Cimarron River Ct
- 4568 Cimarron River Ct
- 704 Cassaday Ct Unit 708
- 4315 Montmorency Ct
- 3300 Narvaez Ave Unit 175
- 4501 Waterville Dr
- 4519 Waterville Dr
- 4464 Bald Eagle Way
- 4970 Cherry Ave Unit 110
- 4970 Cherry Ave Unit 211
- 4570 Waterville Dr
- 3349 Midtown Place Unit 67
- 668 Potomac Ct
- 1267 Hillsdale Ave
- 120 Mountain Springs Dr Unit 120
- 146 Mountain Springs Dr Unit 146
- 337 Ballymore Cir
- 4537 Windsor Park Dr
- 4228 Mountcastle Way
- 4242 Mountcastle Way
- 890 Mulcaster Ct
- 4248 Mountcastle Way
- 4222 Mountcastle Way
- 4182 Mountcastle Way
- 894 Mulcaster Ct
- 884 Mulcaster Ct
- 4239 Mountcastle Way
- 4231 Mountcastle Way
- 4174 Mountcastle Way
- 4225 Mountcastle Way
- 4245 Mountcastle Way
- 4256 Mountcastle Way
- 880 Mulcaster Ct
- 4251 Mountcastle Way
- 4219 Mountcastle Way
- 4168 Mountcastle Way
- 895 Mulcaster Ct
- 4264 Mountcastle Way