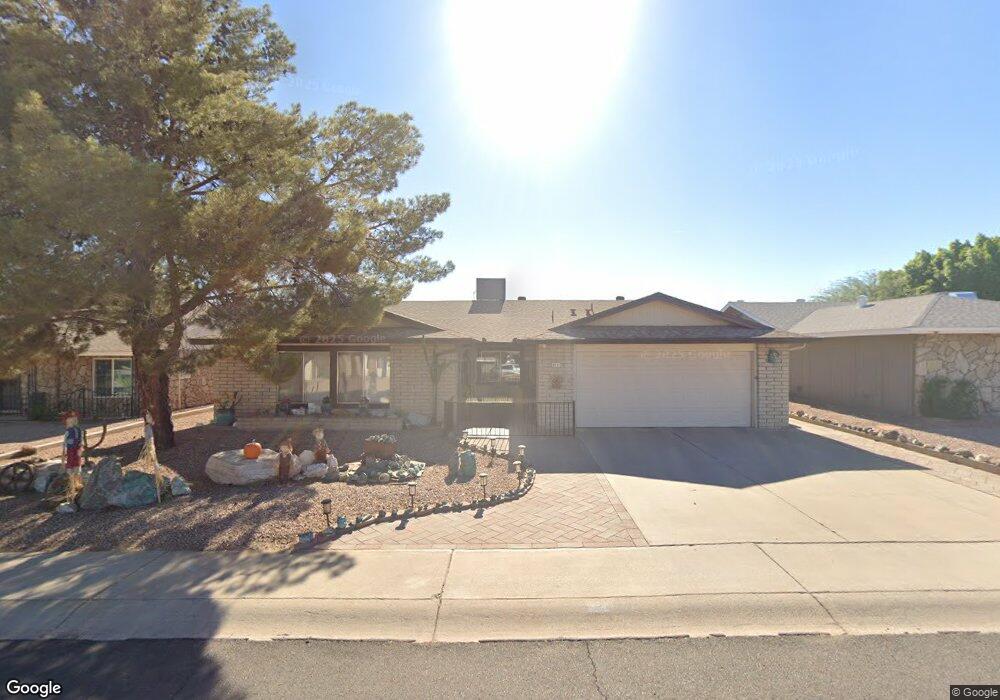
4241 E Mandan St Phoenix, AZ 85044
Ahwatukee NeighborhoodEstimated Value: $343,336 - $892,000
Studio
2
Baths
1,986
Sq Ft
$265/Sq Ft
Est. Value
About This Home
This home is located at 4241 E Mandan St, Phoenix, AZ 85044 and is currently estimated at $526,084, approximately $264 per square foot. 4241 E Mandan St is a home located in Maricopa County with nearby schools including Kyrene de las Lomas School, Kyrene Centennial Middle School, and Mountain Pointe High School.
Ownership History
Date
Name
Owned For
Owner Type
Purchase Details
Closed on
Nov 8, 2018
Sold by
Cook Jerry Robert and Taylor Dell Marie
Bought by
Taylor Dell Marie
Current Estimated Value
Purchase Details
Closed on
Jun 3, 2010
Sold by
Cook Jerry R and Taylor Dell M
Bought by
Cook Jerry Robert and Taylor Dell Marie
Purchase Details
Closed on
Jan 4, 2000
Sold by
Brown Orpha G
Bought by
Cook Jerry R and Taylor Dell M
Home Financials for this Owner
Home Financials are based on the most recent Mortgage that was taken out on this home.
Original Mortgage
$107,900
Interest Rate
7.37%
Mortgage Type
New Conventional
Purchase Details
Closed on
Jul 27, 1994
Sold by
Brown Leonard A and Brown Orpha G
Bought by
Brown Leonard A and Brown Orpha G
Create a Home Valuation Report for This Property
The Home Valuation Report is an in-depth analysis detailing your home's value as well as a comparison with similar homes in the area
Home Values in the Area
Average Home Value in this Area
Purchase History
| Date | Buyer | Sale Price | Title Company |
|---|---|---|---|
| Taylor Dell Marie | -- | None Available | |
| Cook Jerry Robert | -- | None Available | |
| Cook Jerry R | $134,900 | Title Guaranty Agency | |
| Brown Leonard A | -- | -- |
Source: Public Records
Mortgage History
| Date | Status | Borrower | Loan Amount |
|---|---|---|---|
| Previous Owner | Cook Jerry R | $107,900 |
Source: Public Records
Tax History
| Year | Tax Paid | Tax Assessment Tax Assessment Total Assessment is a certain percentage of the fair market value that is determined by local assessors to be the total taxable value of land and additions on the property. | Land | Improvement |
|---|---|---|---|---|
| 2025 | $1,722 | $19,210 | -- | -- |
| 2024 | $1,807 | $19,210 | -- | -- |
| 2023 | $1,807 | $25,070 | $5,010 | $20,060 |
| 2022 | $1,807 | $25,070 | $5,010 | $20,060 |
| 2021 | $1,885 | $22,880 | $4,570 | $18,310 |
| 2020 | $1,838 | $22,430 | $4,480 | $17,950 |
| 2019 | $1,779 | $20,920 | $4,180 | $16,740 |
| 2018 | $1,718 | $19,550 | $3,910 | $15,640 |
| 2017 | $1,640 | $18,010 | $3,600 | $14,410 |
| 2016 | $1,662 | $17,450 | $3,490 | $13,960 |
| 2015 | $1,488 | $15,980 | $3,190 | $12,790 |
Source: Public Records
Map
Nearby Homes
- 4315 E Kiowa St
- 11435 S 46th St
- 12166 S Shoshoni Dr
- 11211 S Bannock St
- 4301 E Walatowa St
- 4302 E Cherokee St
- 12238 S Shoshoni Dr
- 4785 E Kiva St
- 11401 S Shoshoni Dr
- 4722 E Wintu Way
- 11449 S Iroquois Dr
- 12285 S Shoshoni Dr
- 4212 E Sandia St
- 4131 E Ahwatukee Dr
- 3844 E Equestrian Trail
- 4722 E Ahwatukee Dr
- 4829 E Apache Cir
- 3951 E Sequoia Trail
- 12059 S Paiute St
- 4813 E Koso Ct
- 4237 E Mandan St
- 4247 E Mandan St
- 4229 E Mandan St
- 4240 E Mandan St
- 4236 E Mandan St
- 4246 E Mandan St
- 4251 E Mandan St
- 4230 E Mandan St
- 4225 E Mandan St
- 4240 E Winnetka Dr
- 11615 S Tomah St
- 4246 E Winnetka Dr
- 4228 E Winnetka Dr
- 4226 E Mandan St
- 11609 S Tomah St
- 4245 E Zia St
- 4239 E Zia St
- 4219 E Mandan St
- 4251 E Zia St
- 4222 E Winnetka Dr
Your Personal Tour Guide
Ask me questions while you tour the home.