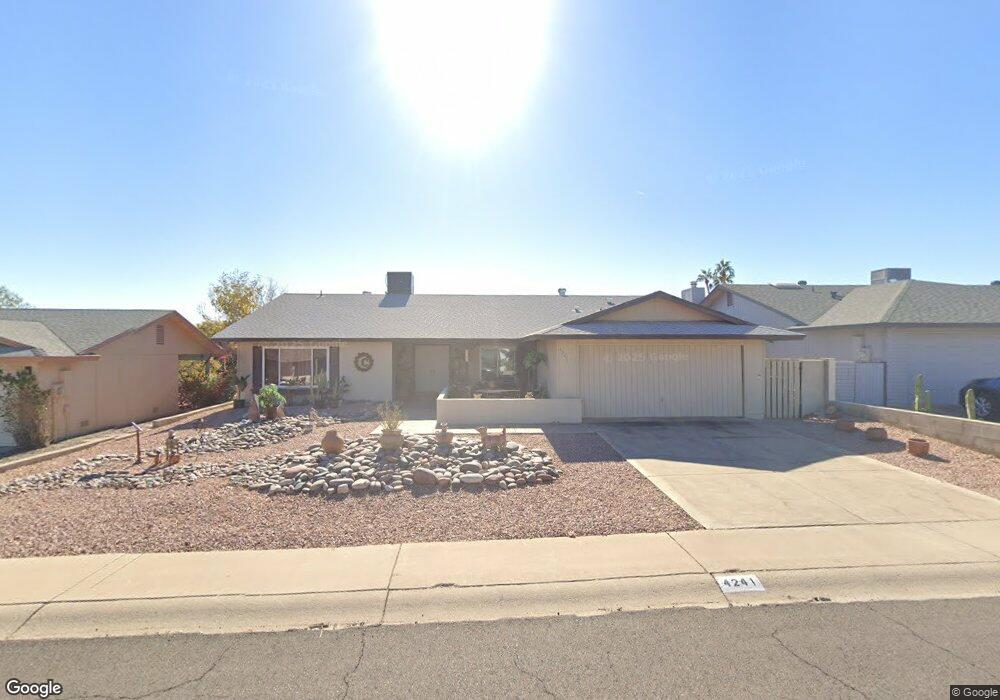
4241 E Sacaton St Phoenix, AZ 85044
Ahwatukee NeighborhoodEstimated Value: $369,269 - $413,000
2
Beds
2
Baths
1,716
Sq Ft
$231/Sq Ft
Est. Value
About This Home
This home is located at 4241 E Sacaton St, Phoenix, AZ 85044 and is currently estimated at $397,067, approximately $231 per square foot. 4241 E Sacaton St is a home located in Maricopa County with nearby schools including Kyrene de las Lomas School, Kyrene Centennial Middle School, and Mountain Pointe High School.
Ownership History
Date
Name
Owned For
Owner Type
Purchase Details
Closed on
May 30, 2003
Sold by
Household Realty Corp
Bought by
Coad Shirley A
Current Estimated Value
Home Financials for this Owner
Home Financials are based on the most recent Mortgage that was taken out on this home.
Original Mortgage
$92,325
Outstanding Balance
$39,708
Interest Rate
5.53%
Mortgage Type
New Conventional
Estimated Equity
$357,359
Purchase Details
Closed on
Mar 13, 2003
Sold by
Retzke George R and Retzke Joann
Bought by
Household Realty Corp
Purchase Details
Closed on
Jul 1, 1998
Sold by
Dahl Ada
Bought by
Retzke George R and Retzke Jo Ann
Home Financials for this Owner
Home Financials are based on the most recent Mortgage that was taken out on this home.
Original Mortgage
$103,799
Interest Rate
7.06%
Mortgage Type
New Conventional
Create a Home Valuation Report for This Property
The Home Valuation Report is an in-depth analysis detailing your home's value as well as a comparison with similar homes in the area
Home Values in the Area
Average Home Value in this Area
Purchase History
| Date | Buyer | Sale Price | Title Company |
|---|---|---|---|
| Coad Shirley A | $123,500 | Fidelity National Title | |
| Household Realty Corp | $107,581 | -- | |
| Retzke George R | $110,000 | Nations Title Insurance |
Source: Public Records
Mortgage History
| Date | Status | Borrower | Loan Amount |
|---|---|---|---|
| Open | Coad Shirley A | $92,325 | |
| Previous Owner | Retzke George R | $103,799 |
Source: Public Records
Tax History
| Year | Tax Paid | Tax Assessment Tax Assessment Total Assessment is a certain percentage of the fair market value that is determined by local assessors to be the total taxable value of land and additions on the property. | Land | Improvement |
|---|---|---|---|---|
| 2025 | $1,789 | $19,961 | -- | -- |
| 2024 | $1,703 | $19,011 | -- | -- |
| 2023 | $1,703 | $29,860 | $5,970 | $23,890 |
| 2022 | $1,622 | $23,510 | $4,700 | $18,810 |
| 2021 | $1,692 | $21,230 | $4,240 | $16,990 |
| 2020 | $1,650 | $20,720 | $4,140 | $16,580 |
| 2019 | $1,597 | $19,270 | $3,850 | $15,420 |
| 2018 | $1,543 | $17,960 | $3,590 | $14,370 |
| 2017 | $1,472 | $16,500 | $3,300 | $13,200 |
| 2016 | $1,492 | $15,810 | $3,160 | $12,650 |
| 2015 | $1,336 | $14,430 | $2,880 | $11,550 |
Source: Public Records
Map
Nearby Homes
- 11211 S Bannock St
- 4315 E Kiowa St
- 4433 E Yawepe St
- 11401 S Shoshoni Dr
- 11825 S 44th St
- 12166 S Shoshoni Dr
- 4722 E Ahwatukee Dr
- 4722 E Wintu Way
- 11449 S Iroquois Dr
- 12002 S Mandan St
- 4785 E Kiva St
- 4345 E Sequoia Trail
- 12238 S Shoshoni Dr
- 4829 E Apache Cir
- 11846 S Winnebago St
- 11451 S Mohave St
- 4302 E Cherokee St
- 4634 E La Puente Ave
- 3844 E Equestrian Trail
- 12285 S Shoshoni Dr
- 4247 E Sacaton St
- 4235 E Sacaton St
- 4240 E Yawepe St
- 4246 E Yawepe St
- 4251 E Sacaton St
- 4234 E Yawepe St
- 4242 E Sacaton St
- 4236 E Sacaton St
- 4248 E Sacaton St
- 4255 E Sacaton St
- 11232 S Pewaukee St
- 4230 E Sacaton St
- 4254 E Yawepe St
- 11238 S Pewaukee St
- 4252 E Sacaton St
- 11244 S Pewaukee St
- 4224 E Sacaton St
- 11230 S Pewaukee St
- 4259 E Sacaton St
Your Personal Tour Guide
Ask me questions while you tour the home.