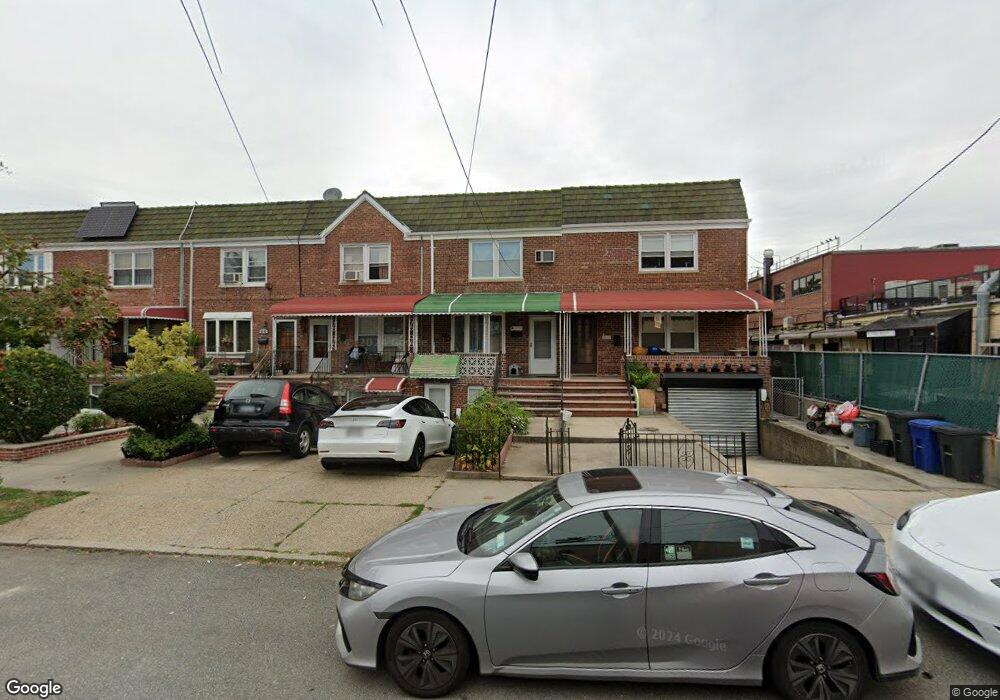
4245 194th St Unit 1+2Fl Flushing, NY 11358
Auburndale NeighborhoodEstimated Value: $900,000 - $997,000
2
Beds
1
Bath
1,472
Sq Ft
$646/Sq Ft
Est. Value
About This Home
This home is located at 4245 194th St Unit 1+2Fl, Flushing, NY 11358 and is currently estimated at $950,418, approximately $645 per square foot. 4245 194th St Unit 1+2Fl is a home located in Queens County with nearby schools including P.S. 31 - Bayside, I.S. 25 Adrien Block, and Francis Lewis High School.
Ownership History
Date
Name
Owned For
Owner Type
Purchase Details
Closed on
Oct 17, 2014
Sold by
Kim Mi Yun
Bought by
Yan Fei
Current Estimated Value
Home Financials for this Owner
Home Financials are based on the most recent Mortgage that was taken out on this home.
Original Mortgage
$404,000
Outstanding Balance
$310,634
Interest Rate
4.18%
Mortgage Type
New Conventional
Estimated Equity
$639,784
Purchase Details
Closed on
Jun 25, 2008
Sold by
Vanvanngo Be Van and Ngo Thi Kim Lien
Bought by
Kim Mi Yun
Home Financials for this Owner
Home Financials are based on the most recent Mortgage that was taken out on this home.
Original Mortgage
$382,000
Interest Rate
6.01%
Mortgage Type
Purchase Money Mortgage
Purchase Details
Closed on
Nov 27, 2000
Sold by
Muqbel Munther M and Muqbel Shirley H
Bought by
Vanngo Be and Ngo Thi Kim Lien
Home Financials for this Owner
Home Financials are based on the most recent Mortgage that was taken out on this home.
Original Mortgage
$196,800
Interest Rate
7.7%
Create a Home Valuation Report for This Property
The Home Valuation Report is an in-depth analysis detailing your home's value as well as a comparison with similar homes in the area
Home Values in the Area
Average Home Value in this Area
Purchase History
| Date | Buyer | Sale Price | Title Company |
|---|---|---|---|
| Yan Fei | $588,000 | -- | |
| Kim Mi Yun | $478,000 | -- | |
| Vanngo Be | $246,000 | Stewart Title |
Source: Public Records
Mortgage History
| Date | Status | Borrower | Loan Amount |
|---|---|---|---|
| Open | Yan Fei | $404,000 | |
| Previous Owner | Kim Mi Yun | $382,000 | |
| Previous Owner | Vanngo Be | $196,800 |
Source: Public Records
Tax History
| Year | Tax Paid | Tax Assessment Tax Assessment Total Assessment is a certain percentage of the fair market value that is determined by local assessors to be the total taxable value of land and additions on the property. | Land | Improvement |
|---|---|---|---|---|
| 2025 | $6,923 | $38,020 | $9,948 | $28,072 |
| 2024 | $6,935 | $35,868 | $10,230 | $25,638 |
| 2023 | $6,516 | $33,840 | $9,339 | $24,501 |
| 2022 | $6,468 | $49,500 | $14,820 | $34,680 |
| 2021 | $6,772 | $51,300 | $14,820 | $36,480 |
| 2020 | $6,410 | $47,880 | $14,820 | $33,060 |
| 2019 | $5,960 | $46,680 | $14,820 | $31,860 |
| 2018 | $5,451 | $28,200 | $10,667 | $17,533 |
| 2017 | $5,449 | $28,200 | $10,816 | $17,384 |
| 2016 | $5,285 | $28,200 | $10,816 | $17,384 |
| 2015 | $2,989 | $26,403 | $12,430 | $13,973 |
| 2014 | $2,989 | $24,909 | $12,454 | $12,455 |
Source: Public Records
Map
Nearby Homes
- 43-44 195th St
- 4048 194th St Unit A3
- 40-38 194th St Unit 1A
- 4038 194th St Unit 3B
- 4032 195th St
- 45-31 195th St
- 196-64 45th Ave
- 190-17 42nd Ave
- 45-47 193rd St
- 4539 192nd St
- 42-36 201st St
- 42-25 189th St
- 192-14 Station Rd
- 194-23 Station Rd
- 19112 Station Rd
- 42-28 189th St
- 188-02 Northern Blvd
- 45-66 196th Place
- 193-02 39th Ave Unit 1
- 4604 195th St
- 4243 194th St
- 4245 194th St
- 4241 194th St
- 4245 194th St
- 4245 194th St
- 4239 194th St
- 42-39 194th St
- 4247 194th St
- 4247 194th St
- 42-47 194th St Unit 1FL
- 4247 194th St Unit 2
- 42-47 194th St Unit 2 Floor
- 4247 194th St
- 4247 194th St Unit 1FL+BM
- 4247 194th St Unit 1FL
- 4247 194th St Unit 1Floor
- 4247 194th St Unit 2Floor
- 4247 194th St Unit 2Floor
- 4237 194th St
- 4235 194th St
Your Personal Tour Guide
Ask me questions while you tour the home.