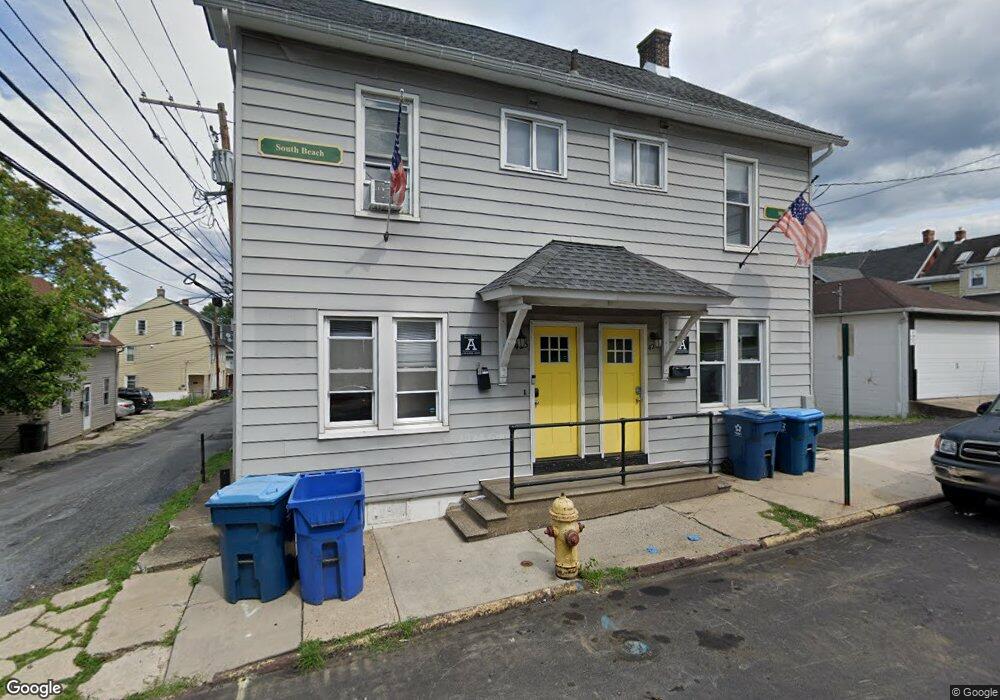
425 Fillmore St Bethlehem, PA 18015
Downtown Bethlehem NeighborhoodEstimated Value: $174,179 - $214,000
3
Beds
1
Bath
1,267
Sq Ft
$159/Sq Ft
Est. Value
About This Home
This home is located at 425 Fillmore St, Bethlehem, PA 18015 and is currently estimated at $201,295, approximately $158 per square foot. 425 Fillmore St is a home located in Northampton County with nearby schools including Donegan Elementary School, Broughal Middle School, and Freedom High School.
Ownership History
Date
Name
Owned For
Owner Type
Purchase Details
Closed on
Nov 20, 2022
Sold by
Spg Lehigh Equities Llc
Bought by
Amicus Spg Llc
Current Estimated Value
Purchase Details
Closed on
Jun 27, 2019
Sold by
Fillmore Street Associates Llc
Bought by
Spg Lehigh Equities Lc
Purchase Details
Closed on
Feb 1, 1988
Bought by
Bianco Frank A
Create a Home Valuation Report for This Property
The Home Valuation Report is an in-depth analysis detailing your home's value as well as a comparison with similar homes in the area
Home Values in the Area
Average Home Value in this Area
Purchase History
| Date | Buyer | Sale Price | Title Company |
|---|---|---|---|
| Amicus Spg Llc | -- | Fidelity National Title | |
| Spg Lehigh Equities Lc | $1,184,000 | Riverside Abstract Llc | |
| Bianco Frank A | $105,000 | -- |
Source: Public Records
Tax History Compared to Growth
Tax History
| Year | Tax Paid | Tax Assessment Tax Assessment Total Assessment is a certain percentage of the fair market value that is determined by local assessors to be the total taxable value of land and additions on the property. | Land | Improvement |
|---|---|---|---|---|
| 2025 | $269 | $24,900 | $5,100 | $19,800 |
| 2024 | $2,201 | $24,900 | $5,100 | $19,800 |
| 2023 | $2,201 | $24,900 | $5,100 | $19,800 |
| 2022 | $2,184 | $24,900 | $5,100 | $19,800 |
| 2021 | $2,169 | $24,900 | $5,100 | $19,800 |
| 2020 | $2,148 | $24,900 | $5,100 | $19,800 |
| 2019 | $2,141 | $24,900 | $5,100 | $19,800 |
| 2018 | $2,089 | $24,900 | $5,100 | $19,800 |
| 2017 | $2,064 | $24,900 | $5,100 | $19,800 |
| 2016 | -- | $24,900 | $5,100 | $19,800 |
| 2015 | -- | $24,900 | $5,100 | $19,800 |
| 2014 | -- | $24,900 | $5,100 | $19,800 |
Source: Public Records
Map
Nearby Homes
- 630 Pierce St
- 705 E 6th St
- 754 E 5th St
- 412 Atlantic St
- 4311 Stonebridge Dr
- 4315 Stonebridge Dr
- 639 Buchanan St
- 539 Atlantic St
- 819 E 4th St
- 815 Laufer St
- 649 Shields St
- 802 Atlantic St
- 818 Atlantic St
- 317 State St
- 11 W 2nd St Unit 366
- 11 W 2nd St Unit 210
- 15 W 2nd St
- 445 Montclair Ave
- 463 Montclair Ave
- 1171 E 4th St