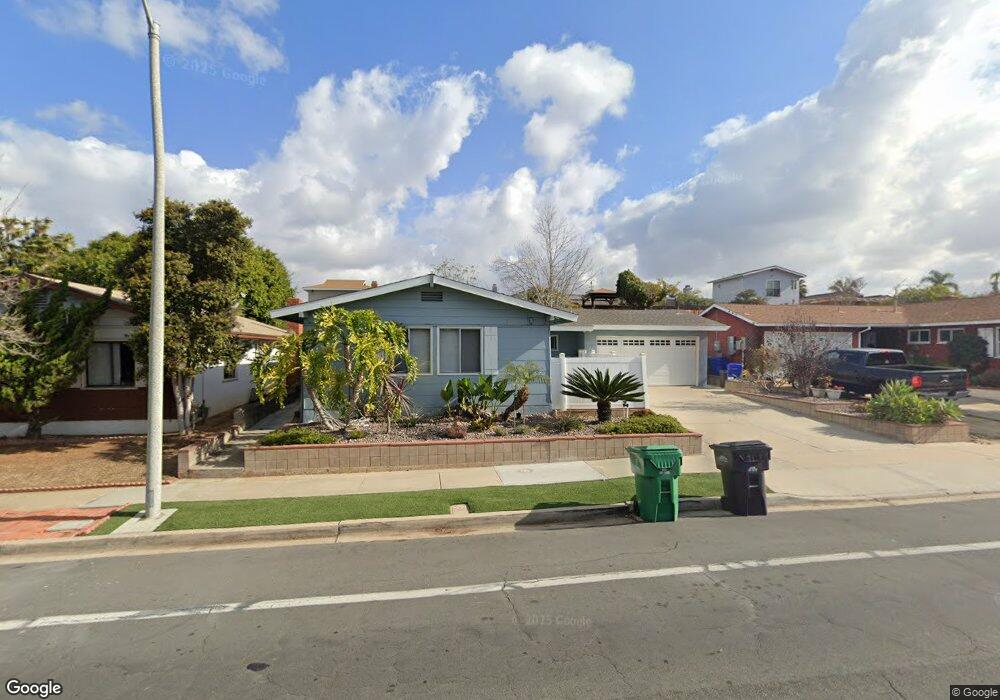
4257 Moraga Ave San Diego, CA 92117
Bay Ho NeighborhoodEstimated Value: $1,108,000 - $1,283,000
3
Beds
2
Baths
1,136
Sq Ft
$1,016/Sq Ft
Est. Value
About This Home
This home is located at 4257 Moraga Ave, San Diego, CA 92117 and is currently estimated at $1,154,595, approximately $1,016 per square foot. 4257 Moraga Ave is a home located in San Diego County with nearby schools including Cadman Elementary School, Marston Middle School, and Clairemont High School.
Ownership History
Date
Name
Owned For
Owner Type
Purchase Details
Closed on
Nov 3, 2020
Sold by
Bailow Michelle Diane and Bailow Jason Ian
Bought by
Jason And Michelle Bailow Family Trust and Bailow
Current Estimated Value
Purchase Details
Closed on
Feb 8, 2005
Sold by
Wilson Mike and Wilson Lysa
Bought by
Bailow Jason and Bailow Michelle
Home Financials for this Owner
Home Financials are based on the most recent Mortgage that was taken out on this home.
Original Mortgage
$416,800
Interest Rate
5.37%
Mortgage Type
Purchase Money Mortgage
Purchase Details
Closed on
Jun 4, 2002
Sold by
Glasco Daisy Belle
Bought by
Wilson Mike and Wilson Lysa
Home Financials for this Owner
Home Financials are based on the most recent Mortgage that was taken out on this home.
Original Mortgage
$284,000
Interest Rate
5.5%
Purchase Details
Closed on
Mar 5, 1999
Sold by
Glasco Daisy B
Bought by
Glasco Daisy Belle
Create a Home Valuation Report for This Property
The Home Valuation Report is an in-depth analysis detailing your home's value as well as a comparison with similar homes in the area
Home Values in the Area
Average Home Value in this Area
Purchase History
| Date | Buyer | Sale Price | Title Company |
|---|---|---|---|
| Jason And Michelle Bailow Family Trust | -- | None Listed On Document | |
| Bailow Jason | $521,000 | Diversified Title | |
| Wilson Mike | $355,000 | Chicago Title Co | |
| Glasco Daisy Belle | -- | -- |
Source: Public Records
Mortgage History
| Date | Status | Borrower | Loan Amount |
|---|---|---|---|
| Previous Owner | Bailow Jason | $416,800 | |
| Previous Owner | Wilson Mike | $284,000 | |
| Closed | Wilson Mike | $53,250 |
Source: Public Records
Tax History Compared to Growth
Tax History
| Year | Tax Paid | Tax Assessment Tax Assessment Total Assessment is a certain percentage of the fair market value that is determined by local assessors to be the total taxable value of land and additions on the property. | Land | Improvement |
|---|---|---|---|---|
| 2025 | $8,692 | $726,178 | $620,250 | $105,928 |
| 2024 | $8,692 | $711,940 | $608,089 | $103,851 |
| 2023 | $8,499 | $697,981 | $596,166 | $101,815 |
| 2022 | $8,271 | $684,296 | $584,477 | $99,819 |
| 2021 | $8,213 | $670,879 | $573,017 | $97,862 |
| 2020 | $8,113 | $664,001 | $567,142 | $96,859 |
| 2019 | $7,967 | $650,982 | $556,022 | $94,960 |
| 2018 | $7,447 | $638,219 | $545,120 | $93,099 |
| 2017 | $80 | $600,000 | $508,000 | $92,000 |
| 2016 | $6,054 | $520,000 | $441,000 | $79,000 |
| 2015 | $5,761 | $495,000 | $420,000 | $75,000 |
| 2014 | $5,371 | $460,000 | $391,000 | $69,000 |
Source: Public Records
Map
Nearby Homes
- 4150 Taos Dr
- 3129 Driscoll Dr
- 4135 Huerfano Ave
- 3701 Tavara Cir
- 4527 Kickapoo Ct
- 4048 Raffee Dr
- 3582 Hatteras Ave
- 4060 Huerfano Ave Unit 146
- 4060 Huerfano Ave Unit 130
- 4060 Huerfano Ave Unit 125
- 4060 Huerfano Ave Unit 240
- 4060 Huerfano Ave Unit 126
- 3571 Idlewild Way
- 4010 Paducah Dr
- 4425 Caminito Pedernal
- 3212 Cadden Ct
- 4543 Moraga Ave
- 3903 Cadden Way
- 4182 Seri St
- 4203 Tolowa St
- 4263 Moraga Ave
- 4251 Moraga Ave
- 4258 Taos Dr
- 4264 Taos Dr
- 4269 Moraga Ave
- 4245 Moraga Ave
- 4252 Taos Dr
- 4270 Taos Dr
- 4256 Moraga Ave
- 4275 Moraga Ave
- 4296 Tacoma St
- 4239 Moraga Ave
- 4246 Taos Dr
- 4268 Moraga Ave
- 4276 Taos Dr Unit 17
- 4262 Moraga Ave
- 4274 Moraga Ave
- 4240 Taos Dr
- 4288 Tacoma St
- 4281 Moraga Ave