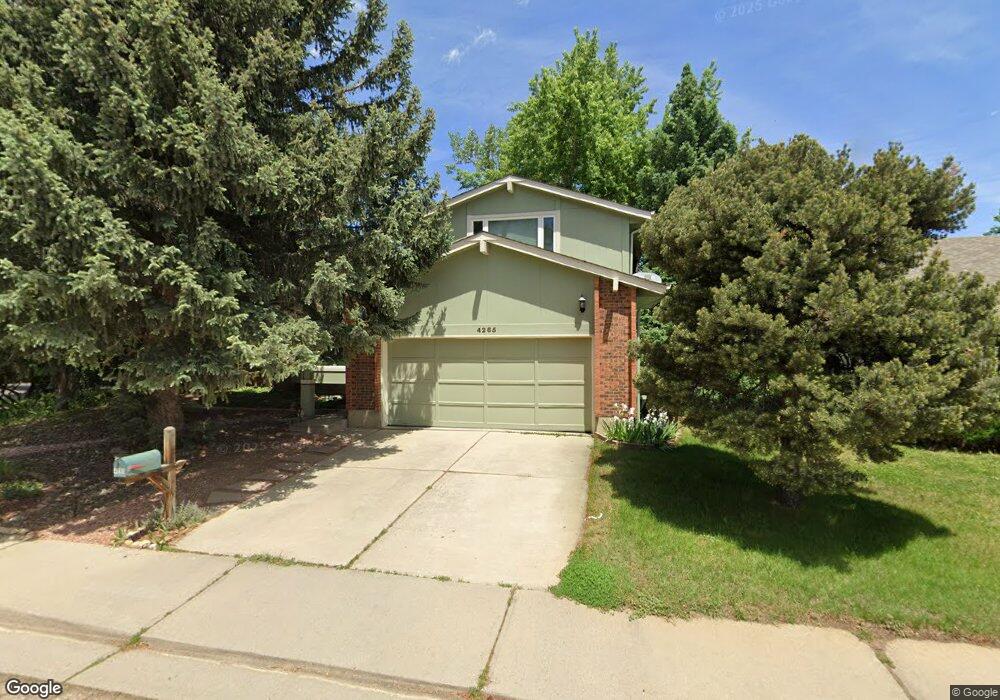
4265 Redwood Place Boulder, CO 80301
Palo Park NeighborhoodEstimated Value: $825,315 - $1,094,000
3
Beds
2
Baths
1,114
Sq Ft
$866/Sq Ft
Est. Value
About This Home
This home is located at 4265 Redwood Place, Boulder, CO 80301 and is currently estimated at $965,079, approximately $866 per square foot. 4265 Redwood Place is a home located in Boulder County with nearby schools including Crest View Elementary School, Centennial Middle School, and Boulder High School.
Ownership History
Date
Name
Owned For
Owner Type
Purchase Details
Closed on
Jul 9, 2009
Sold by
Bright Kathryn L and Faulk Kathryn B
Bought by
Bright Kathryn L
Current Estimated Value
Home Financials for this Owner
Home Financials are based on the most recent Mortgage that was taken out on this home.
Original Mortgage
$214,000
Outstanding Balance
$140,237
Interest Rate
5.39%
Mortgage Type
New Conventional
Estimated Equity
$824,842
Purchase Details
Closed on
Sep 14, 2006
Sold by
Faulk Edward James and Bright Kathryn L
Bought by
Bright Kathryn L and Faulk Kathryn B
Purchase Details
Closed on
Jan 31, 1997
Sold by
Sather Bradley K and Sather Ann E
Bought by
Faulk Kathryn B
Home Financials for this Owner
Home Financials are based on the most recent Mortgage that was taken out on this home.
Original Mortgage
$160,000
Interest Rate
7.73%
Purchase Details
Closed on
Dec 22, 1992
Bought by
Bright Kathryn L
Purchase Details
Closed on
Sep 20, 1984
Bought by
Bright Kathryn L
Purchase Details
Closed on
Jan 12, 1982
Bought by
Bright Kathryn L
Create a Home Valuation Report for This Property
The Home Valuation Report is an in-depth analysis detailing your home's value as well as a comparison with similar homes in the area
Home Values in the Area
Average Home Value in this Area
Purchase History
| Date | Buyer | Sale Price | Title Company |
|---|---|---|---|
| Bright Kathryn L | -- | Land Title Guarantee Company | |
| Bright Kathryn L | -- | None Available | |
| Faulk Kathryn B | $200,000 | -- | |
| Bright Kathryn L | $155,000 | -- | |
| Bright Kathryn L | $106,000 | -- | |
| Bright Kathryn L | -- | -- |
Source: Public Records
Mortgage History
| Date | Status | Borrower | Loan Amount |
|---|---|---|---|
| Open | Bright Kathryn L | $214,000 | |
| Closed | Faulk Kathryn B | $160,000 |
Source: Public Records
Tax History Compared to Growth
Tax History
| Year | Tax Paid | Tax Assessment Tax Assessment Total Assessment is a certain percentage of the fair market value that is determined by local assessors to be the total taxable value of land and additions on the property. | Land | Improvement |
|---|---|---|---|---|
| 2025 | $5,219 | $57,812 | $35,356 | $22,456 |
| 2024 | $5,219 | $57,812 | $35,356 | $22,456 |
| 2023 | $5,133 | $63,081 | $36,368 | $30,398 |
| 2022 | $4,269 | $50,638 | $32,832 | $17,806 |
| 2021 | $4,071 | $52,095 | $33,777 | $18,318 |
| 2020 | $3,543 | $45,803 | $33,534 | $12,269 |
| 2019 | $3,489 | $45,803 | $33,534 | $12,269 |
| 2018 | $3,916 | $42,955 | $29,952 | $13,003 |
| 2017 | $3,799 | $47,490 | $33,114 | $14,376 |
| 2016 | $3,587 | $39,362 | $28,178 | $11,184 |
| 2015 | $3,406 | $30,535 | $11,622 | $18,913 |
| 2014 | $2,802 | $30,535 | $11,622 | $18,913 |
Source: Public Records
Map
Nearby Homes
- 4143 Sunrise Ct
- 2770 Arbor Glen Place
- 3809 Paseo Del Prado St
- 3807 Paseo Del Prado St
- 4557 Apple Way
- 3722 Monterey Place
- 2558 Premier Place
- 3693 Silverton St
- 3766 Ridgeway St
- 4190 Longview Ln
- 2736 Winding Trail Dr
- 2512 Premier Place
- 2528 Pampas Ct
- 2835 Links Dr
- 2672 Winding Trail Dr
- 4624 S Hampton Cir
- 3668 Pinedale St
- 3673 Hazelwood Ct
- 3895 Norwood Ct
- 2362 Spotswood Place
- 4275 Redwood Place
- 4266 Redwood Ct
- 4276 Redwood Ct
- 4255 Redwood Place
- 4285 Redwood Place
- 4264 Redwood Place
- 4286 Redwood Ct
- 4274 Redwood Place
- 4256 Redwood Ct
- 4245 Redwood Place
- 4254 Redwood Place
- 4295 Redwood Place
- 4246 Redwood Ct
- 4296 Redwood Ct
- 4244 Redwood Place
- 4235 Redwood Place
- 4267 Redwood Ct
- 4277 Redwood Ct
- 4107 Nevis St
- 4087 Nevis St