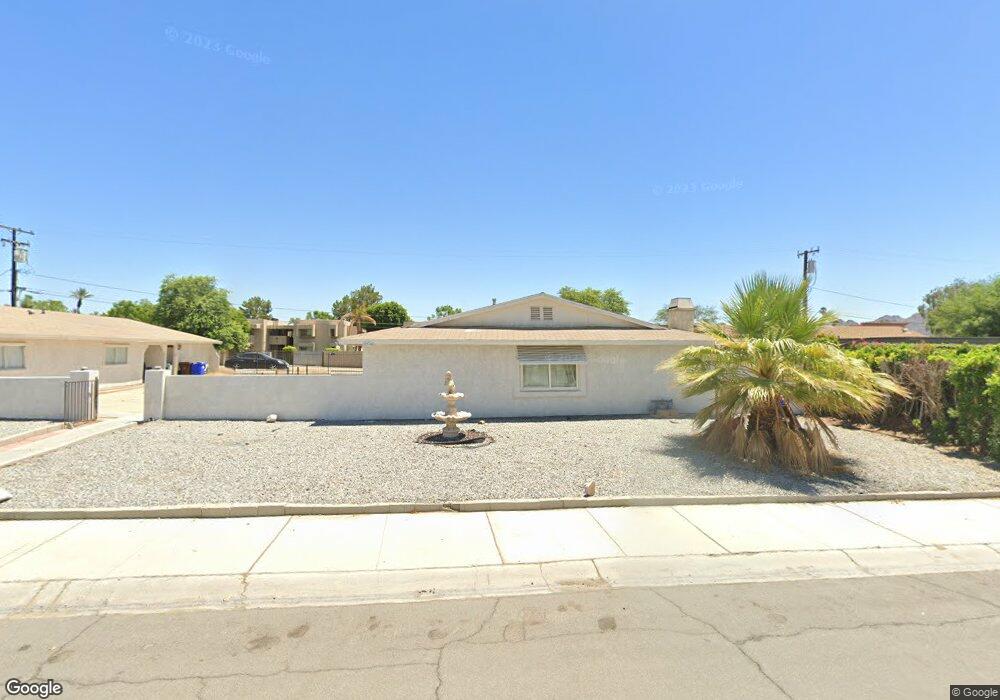
42740 Clifford St Palm Desert, CA 92260
Estimated Value: $578,964 - $898,000
4
Beds
4
Baths
2,006
Sq Ft
$361/Sq Ft
Est. Value
About This Home
This home is located at 42740 Clifford St, Palm Desert, CA 92260 and is currently estimated at $724,991, approximately $361 per square foot. 42740 Clifford St is a home located in Riverside County with nearby schools including James Earl Carter Elementary School, Colonel Mitchell Paige Middle School, and Palm Desert High School.
Ownership History
Date
Name
Owned For
Owner Type
Purchase Details
Closed on
Jun 9, 2022
Sold by
Quang Vu Huy and Yen Kimberly
Bought by
Huy Quang Vu And Kimberly Yen Vu Revocable Tr
Current Estimated Value
Purchase Details
Closed on
Nov 22, 2021
Sold by
Koziak Helen V and The Helen V Kozlak Property Tr
Bought by
Vu Kimberly Yen and Vu Huy Quang
Home Financials for this Owner
Home Financials are based on the most recent Mortgage that was taken out on this home.
Original Mortgage
$376,250
Interest Rate
3.14%
Mortgage Type
New Conventional
Purchase Details
Closed on
Feb 3, 2018
Sold by
Kozlak Helen V
Bought by
Kozlak Helen V and The Helen V Kozlak Separate Property Tr
Purchase Details
Closed on
Sep 18, 2017
Sold by
Kozlak Peter J and Kozlak Helen V
Bought by
Kozlak Helen V
Create a Home Valuation Report for This Property
The Home Valuation Report is an in-depth analysis detailing your home's value as well as a comparison with similar homes in the area
Home Values in the Area
Average Home Value in this Area
Purchase History
| Date | Buyer | Sale Price | Title Company |
|---|---|---|---|
| Huy Quang Vu And Kimberly Yen Vu Revocable Tr | -- | None Listed On Document | |
| Vu Kimberly Yen | $537,500 | North American Title | |
| Kozlak Helen V | -- | None Available | |
| Kozlak Helen V | -- | None Available |
Source: Public Records
Mortgage History
| Date | Status | Borrower | Loan Amount |
|---|---|---|---|
| Previous Owner | Vu Kimberly Yen | $376,250 |
Source: Public Records
Tax History Compared to Growth
Tax History
| Year | Tax Paid | Tax Assessment Tax Assessment Total Assessment is a certain percentage of the fair market value that is determined by local assessors to be the total taxable value of land and additions on the property. | Land | Improvement |
|---|---|---|---|---|
| 2025 | $8,255 | $570,397 | $142,731 | $427,666 |
| 2023 | $8,255 | $548,250 | $137,190 | $411,060 |
| 2022 | $7,702 | $537,500 | $134,500 | $403,000 |
| 2021 | $2,682 | $134,865 | $40,453 | $94,412 |
| 2020 | $2,650 | $133,483 | $40,039 | $93,444 |
| 2019 | $2,610 | $130,866 | $39,254 | $91,612 |
| 2018 | $2,573 | $128,301 | $38,485 | $89,816 |
| 2017 | $2,525 | $125,786 | $37,731 | $88,055 |
| 2016 | $2,470 | $123,321 | $36,992 | $86,329 |
| 2015 | $2,456 | $121,471 | $36,438 | $85,033 |
| 2014 | $2,171 | $119,093 | $35,725 | $83,368 |
Source: Public Records
Map
Nearby Homes
- 74761 Leslie Ave
- 42671 Susan Cir
- 74626 Lavender Way
- 42570 Stephani Cir
- 43412 Amaryllis Way
- 43376 Cook St Unit 220
- 43376 Cook St Unit 84
- 43376 Cook St Unit 161
- 74636 Azurite Cir E
- 74628 Azurite Cir E
- 74612 Azurite Cir E
- 74596 Azurite Cir E
- 74671 Azurite Cir E Unit E
- 74647 Azurite Cir E
- 74560 Moss Rose Dr
- 14 Calle Lantana
- 74578 Zircon Cir E
- 43052 Via Siena
- 74411 Gary Ave
- 74529 Azurite Cir E
- 42740 Clifford St Unit C
- 42770 Clifford St
- 42720 Clifford St
- 42690 Clifford St
- 42800 Clifford St
- 0 Clifford St
- 42685 Cook St
- 42735 Cook St
- 42662 Clifford St
- 42818 Clifford St
- 42634 Clifford St
- 42625 Cook St
- 42655 Cook St
- 74 Sheryl Ave Unit 10-3
- 74800 Sheryl Ave Unit 1
- 74800 Sheryl Ave Unit 93
- 74800 Sheryl Ave Unit 171
- 74800 Sheryl Ave Unit 16-4
- 74800 Sheryl Ave Unit 24
- 74800 Sheryl Ave Unit 71