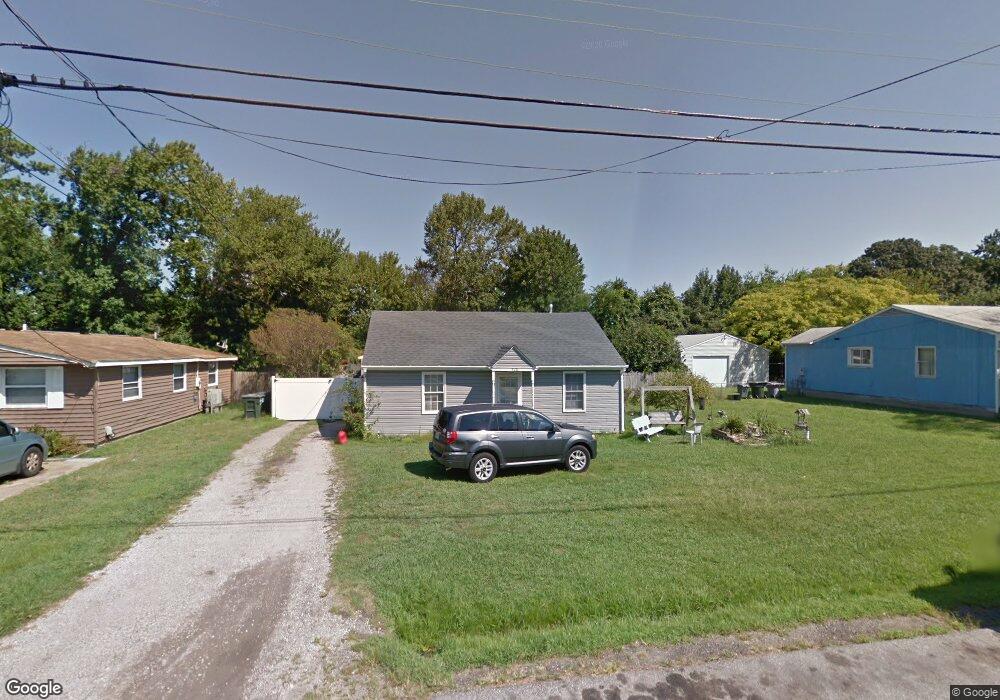
428 Rogers Ave Hampton, VA 23664
Buckroe Beach NeighborhoodEstimated Value: $199,000 - $219,000
2
Beds
1
Bath
1,040
Sq Ft
$200/Sq Ft
Est. Value
About This Home
This home is located at 428 Rogers Ave, Hampton, VA 23664 and is currently estimated at $208,359, approximately $200 per square foot. 428 Rogers Ave is a home located in Hampton City with nearby schools including Francis Asbury Elementary School, Benjamin Syms Middle School, and Phoebus High School.
Ownership History
Date
Name
Owned For
Owner Type
Purchase Details
Closed on
Jan 23, 2008
Sold by
Sugarplum Ltd Prtnrshp
Bought by
Grider Robert
Current Estimated Value
Home Financials for this Owner
Home Financials are based on the most recent Mortgage that was taken out on this home.
Original Mortgage
$48,025
Outstanding Balance
$30,330
Interest Rate
6.17%
Mortgage Type
New Conventional
Estimated Equity
$178,029
Purchase Details
Closed on
Feb 21, 2001
Sold by
Prof Foreclosure Corp Of
Bought by
Homeside Lending Inc
Create a Home Valuation Report for This Property
The Home Valuation Report is an in-depth analysis detailing your home's value as well as a comparison with similar homes in the area
Home Values in the Area
Average Home Value in this Area
Purchase History
| Date | Buyer | Sale Price | Title Company |
|---|---|---|---|
| Grider Robert | $60,036 | -- | |
| Homeside Lending Inc | $26,439 | -- |
Source: Public Records
Mortgage History
| Date | Status | Borrower | Loan Amount |
|---|---|---|---|
| Open | Grider Robert | $48,025 | |
| Closed | Grider Robert | $12,007 |
Source: Public Records
Tax History
| Year | Tax Paid | Tax Assessment Tax Assessment Total Assessment is a certain percentage of the fair market value that is determined by local assessors to be the total taxable value of land and additions on the property. | Land | Improvement |
|---|---|---|---|---|
| 2025 | $2,183 | $185,700 | $66,000 | $119,700 |
| 2024 | $1,953 | $169,800 | $66,000 | $103,800 |
| 2023 | $1,826 | $157,400 | $60,000 | $97,400 |
| 2022 | $1,679 | $142,300 | $50,400 | $91,900 |
| 2021 | $1,675 | $124,600 | $42,000 | $82,600 |
| 2020 | $1,435 | $115,700 | $42,000 | $73,700 |
| 2019 | $1,435 | $115,700 | $42,000 | $73,700 |
| 2018 | $1,479 | $116,900 | $42,000 | $74,900 |
| 2017 | $1,544 | $0 | $0 | $0 |
| 2016 | $1,415 | $106,500 | $0 | $0 |
| 2015 | $1,415 | $0 | $0 | $0 |
| 2014 | $1,443 | $106,500 | $47,600 | $58,900 |
Source: Public Records
Map
Nearby Homes
- 449 Benthall Rd
- 417 Hunlac Ave
- 408 Rogers Ave
- 403 Benthall Rd
- 205 Benthall Rd
- 309 Benthall Rd
- 14 Jayne Lee Dr
- 307 N First St
- 231 Benthall Rd
- 1040 Porte Harbour Arch
- 13 Fields Dr
- 235 N First St
- 1030 Porte Harbour Arch
- 334 N First St Unit 18
- 334 N First St
- 750 N First St
- 123 N Sixth St
- 2013 N Mallory St
- 1003 High Dunes Quay Unit 101
- 214 N First St
Your Personal Tour Guide
Ask me questions while you tour the home.